
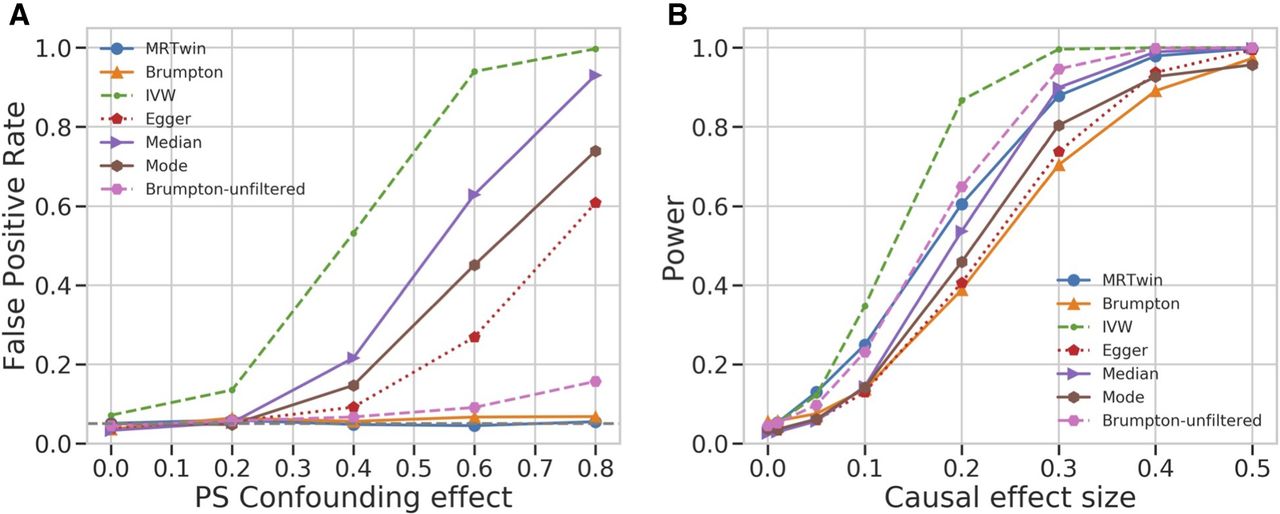
Figure 3.
FPR and power comparison between various methods run on simulated trio data. This is similar to Figure 2 except that IVW, Egger, Median, and Mode are run on the offspring of the trio data set instead of the large “external” group of unrelated individuals, such that all methods have the same sample size. (A) FPR (y-axis) under varying levels of confounding owing to population stratification (PS), with the x-axis describing the magnitude of the effect of the population labels on the exposure and outcome trait. (B) Power (y-axis) as a function of the causal effect size (x-axis). Results are averaged over 1000 simulation replicates.


