
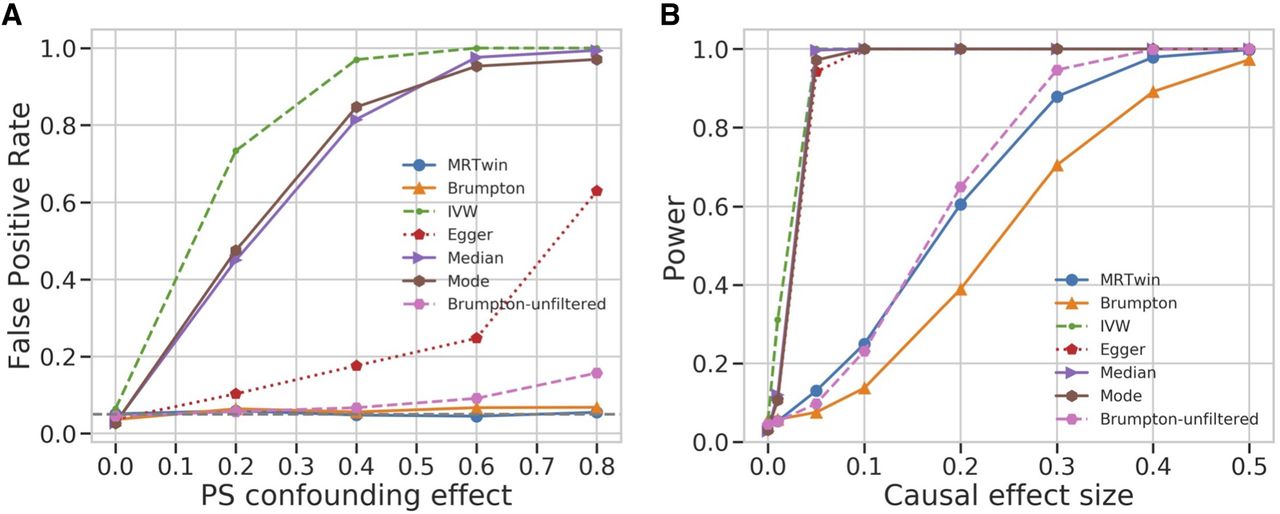
Figure 2.
False-positive rate (FPR) and power comparison between various methods run on simulated data. (A) FPR (y-axis) under varying levels of confounding owing to population stratification (PS), with the x-axis describing the magnitude of the confounding effect of population labels on the exposure and outcome trait. (B) Power (y-axis) as a function of the magnitude of the causal effect of the exposure on the outcome trait (x-axis) in a setting with no confounding. Results are averaged over 1000 simulation replicates.


