
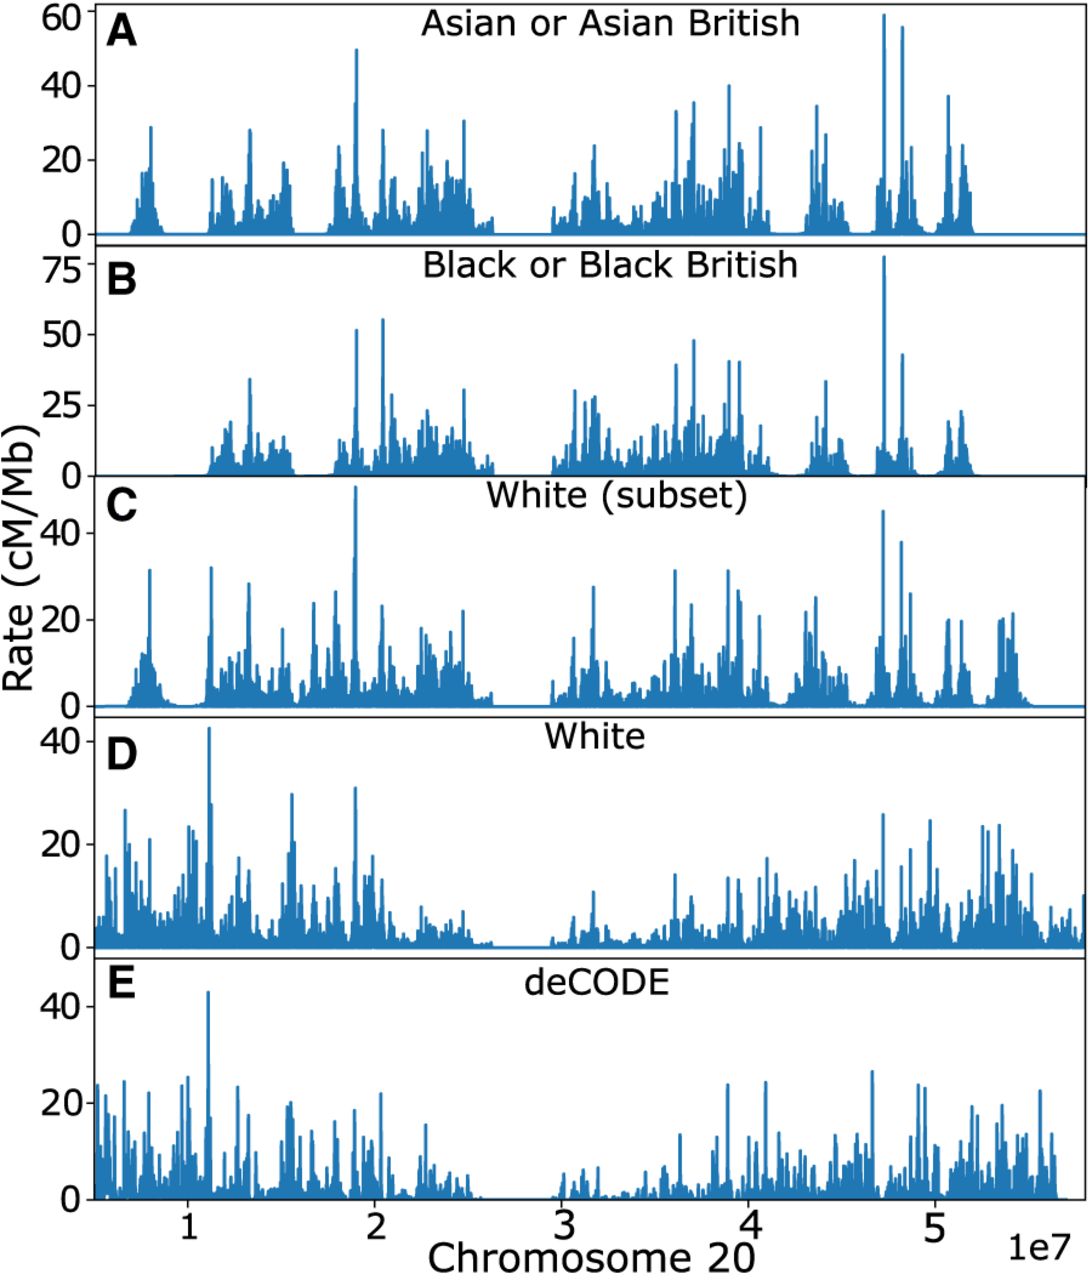
Figure 8.
Estimated rates using different subsets of UK Biobank across Chromosome 20: (A) Asian or Asian British, (B) Black or Black British, (C) subset of White individuals, and (D) all White individuals. The rates from deCODE (sex averaged) are presented for comparison (E).


