
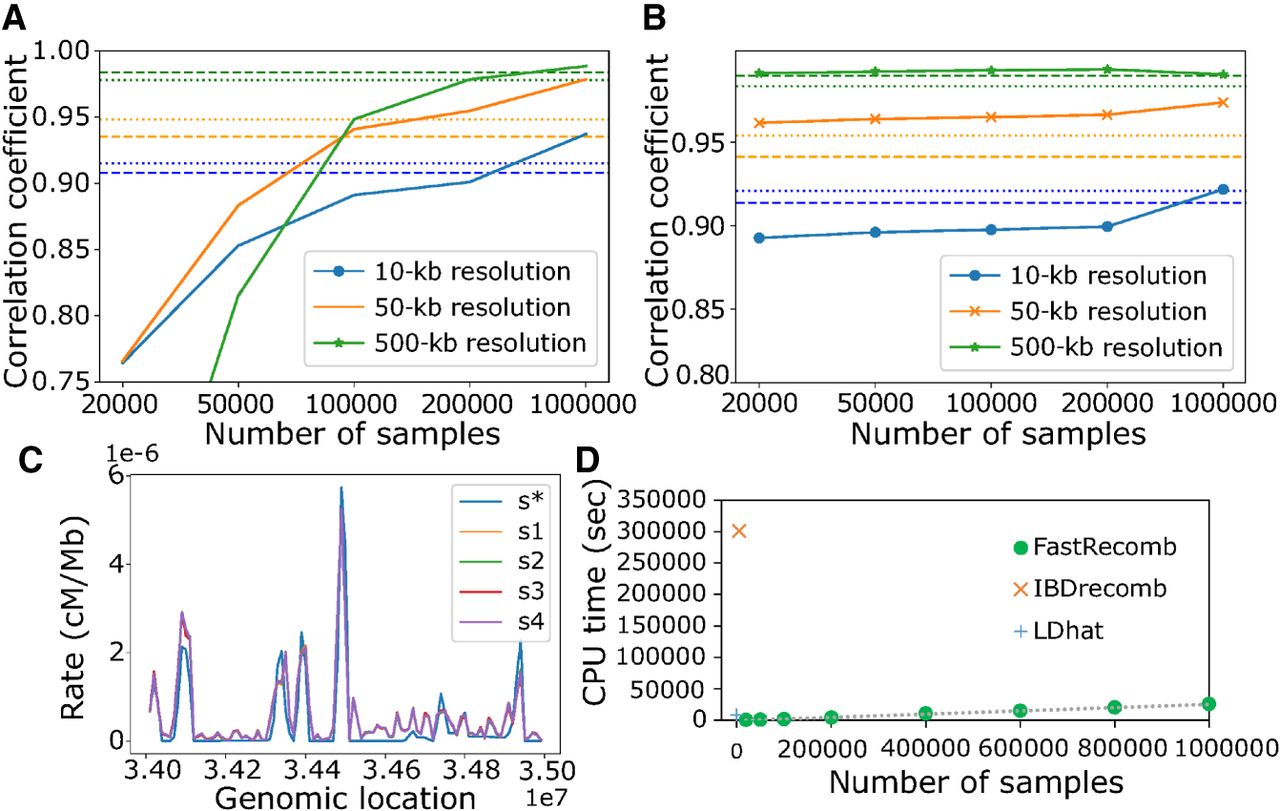
Effect of sample size on the performance of FastRecomb. (A) Pearson correlation coefficient of FastRecomb improves with the increasing number of haplotypes. (B) Smaller cutoff length will result in better performance with smaller number of samples. The minimum cutoff for A is l = 0.5 cM and for B is l = 0.1 cM. Estimated rates for four different 50,000 subsets (s1, s2, s3, and s4) out of the 200,000 sample in the 34- to 35-MB genomic region at 10-kb resolution are depicted in C. The minimum cutoff was set to l = 0.5 cM. s* denotes the recombination rates in the simulated data. (D) The running time increases linearly with the sample size. The error rates for all runs were set to 0.1%. Dashed and dotted lines represent the IBDrecomb and LDhat results, respectively.


