
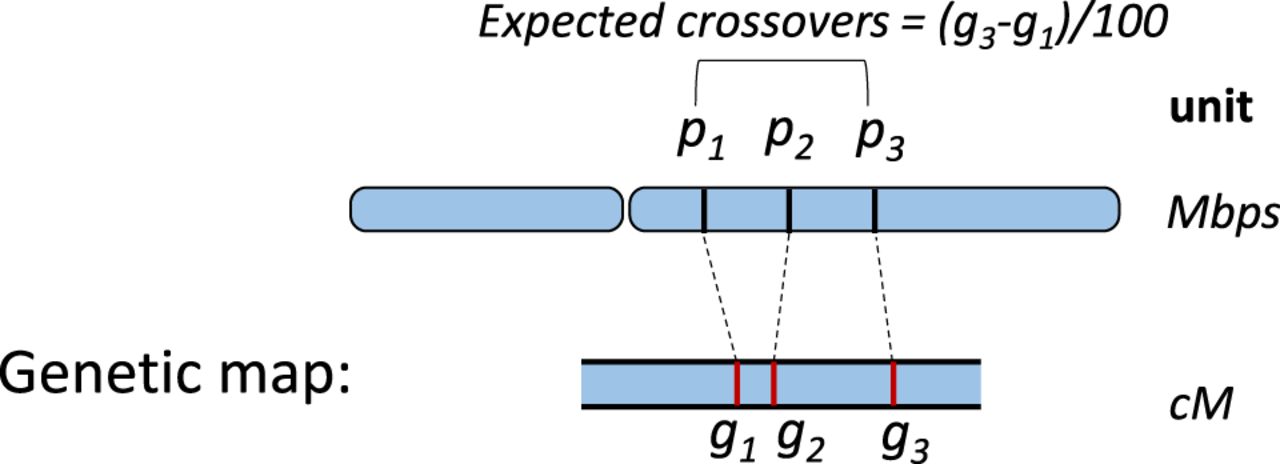
Figure 1.
An example of a genetic map for a chromosome. The expected average number of intervening crossovers in a generation within (p1, p2) and (p1, p3) are (g2 − g1)/100 and (g3 − g1)/100, respectively.
(Downloading may take up to 30 seconds. If the slide opens in your browser, select File -> Save As to save it.)
Click on image to view larger version.
An example of a genetic map for a chromosome. The expected average number of intervening crossovers in a generation within (p1, p2) and (p1, p3) are (g2 − g1)/100 and (g3 − g1)/100, respectively.
 CiteULike
 Delicious
 Digg
Digg Facebook
 Google+
 Reddit
 Twitter
