
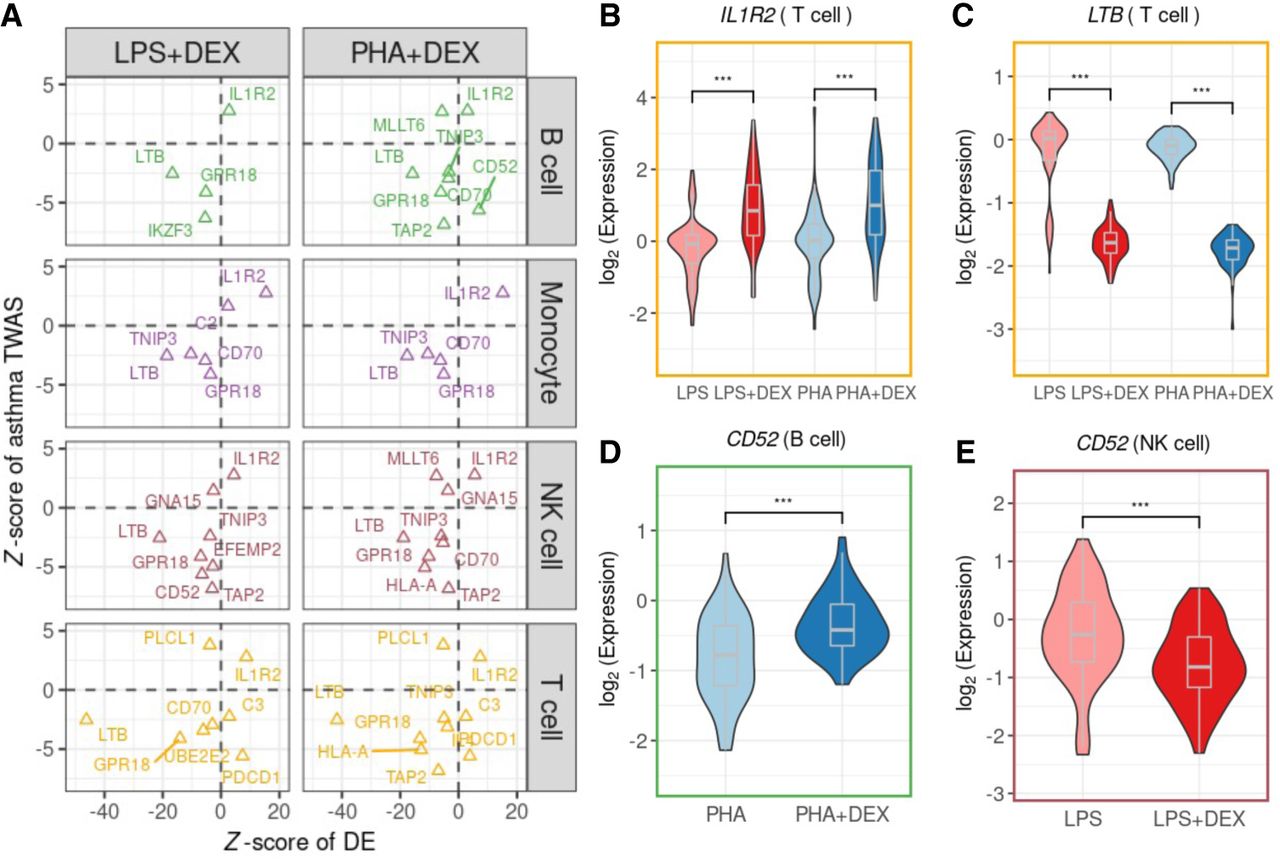
Figure 8.
The roles of treatments in the asthma-determined genes: (A) Scatterplots of the Z-score of DEX effects (x-axis) on 18 asthma-associated genes against the Z-score from PTWAS (y-axis). Each row and dot color represents the cell type. (B–E) Example genes: (B) IL1R2 in T cells, (C) LTB in T cells, and (D,E) CD52 in B cells and NK cells. Each violin plot summarizes individual average gene expression.


