
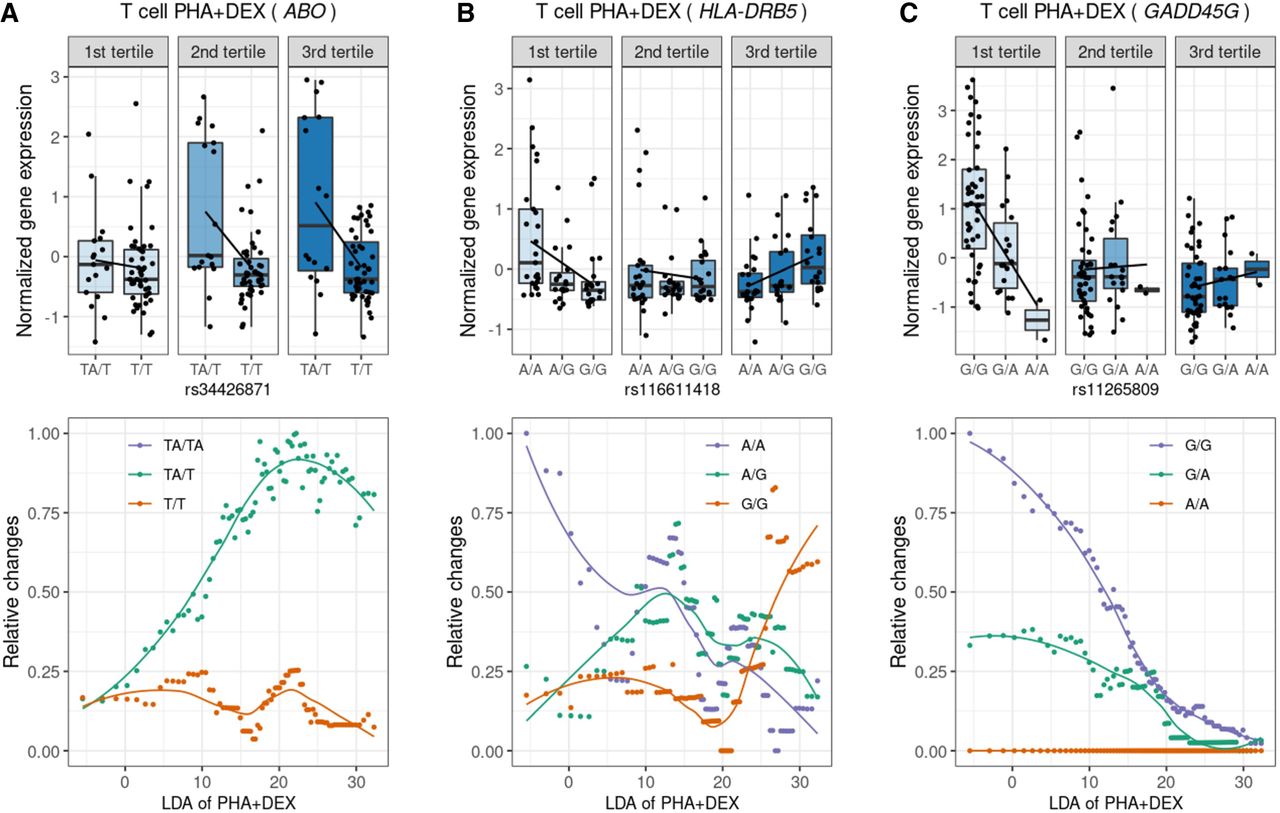
Figure 7.
Identification of dynamic eQTLs along immune response pseudotime. For the genes ABO (A), HLA-DRB5 (B), and GADD45G (C), the boxplots on the top represent normalized gene expression in T cells treated with PHA + DEX for each DLDA pseudotime tertile and genotype, and the bottom plots represent the smoothed dynamic gene expression changes along response trajectory pseudotime for each genotype separately (trend lines are fit using locally estimated scatterplot smoothing).


