
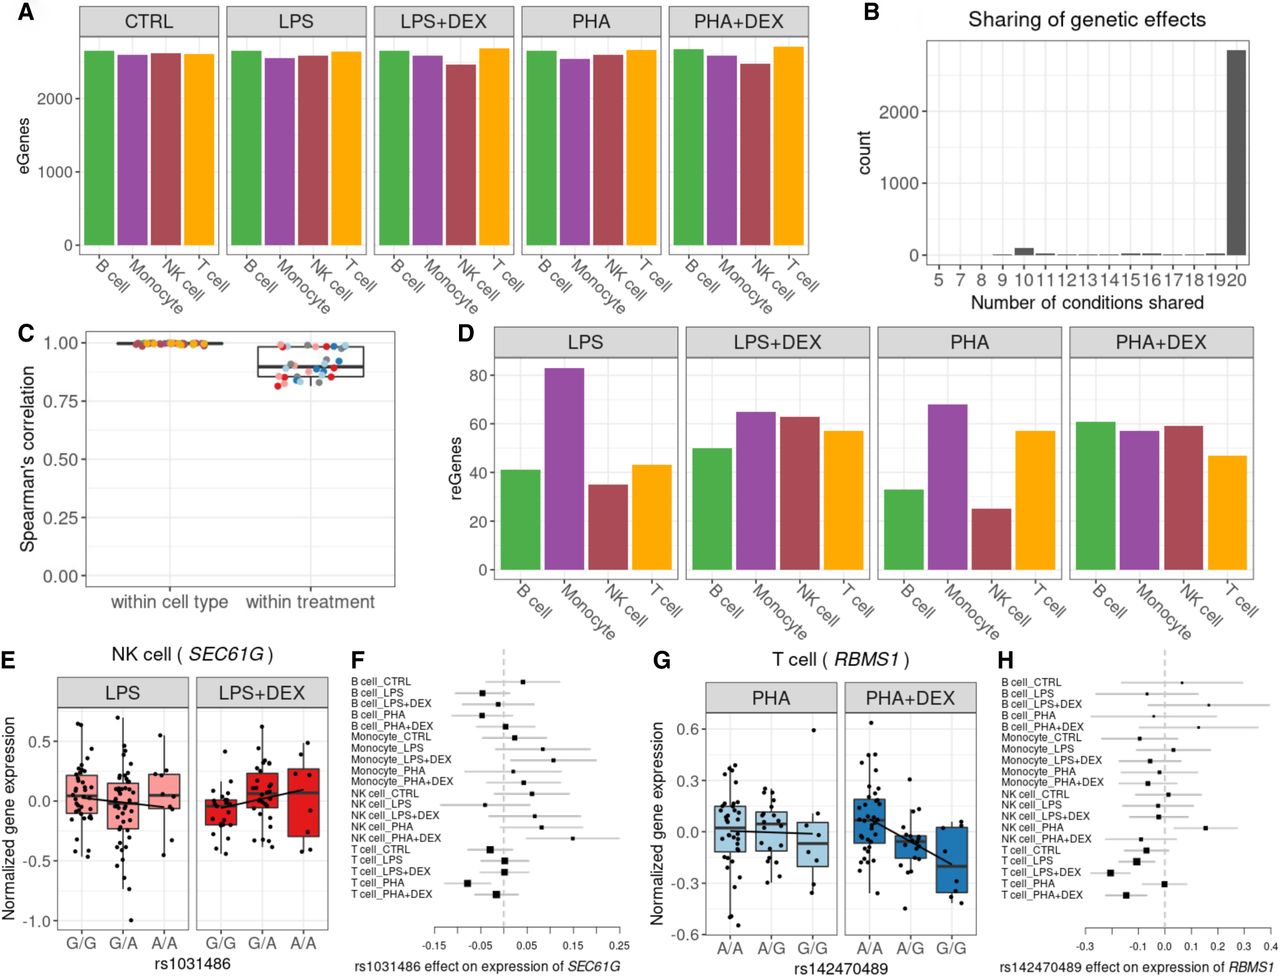
Genetic effects on gene expression. (A) Barplot of the number of genes with eQTLs (eGenes) in each condition significant in multivariate adaptive shrinkage analysis (10% LFSR). (B) Barplot of the number of eGenes (y-axis) with genetic effects in the same direction across the number of conditions shared (x-axis). (C) Boxplot of Spearman's correlations between significant genetic effects on gene expression for each pairwise comparison of two treatment conditions within each cell type and for each pairwise comparison of two cell types within each treatment condition; color reflects cell types (as in A) or treatment: control (gray), LPS (pink), LPS + DEX (red), PHA (light blue), and PHA + DEX (dark blue). (D) Barplot of the number of genes with response eQTLs (reGenes). (E) Boxplot of normalized gene expression for SEC61G gene in NK cells treated with LPS (left) and LPS + DEX (right) across the three genotype classes of the reQTL rs1031486 (x-axis). (F) Forest plot of the estimated genetic effect for rs1031486 minor allele on the expression of the SEC61G gene across all conditions (values reflect slopes as in E). Each line represents the 95% confidence interval around the estimate. (G) Boxplot of normalized gene expression for RBMS1 gene in T cells treated with PHA (left) and PHA + DEX (right) across the three genotype classes of the reQTL rs142470489 (x-axis). (H) Forest plot of the estimated genetic effect of rs142470489 minor allele on the expression of the IRF3 gene across all conditions (values reflect slopes as in G). Each line represents the 95% confidence interval around the estimate.


