
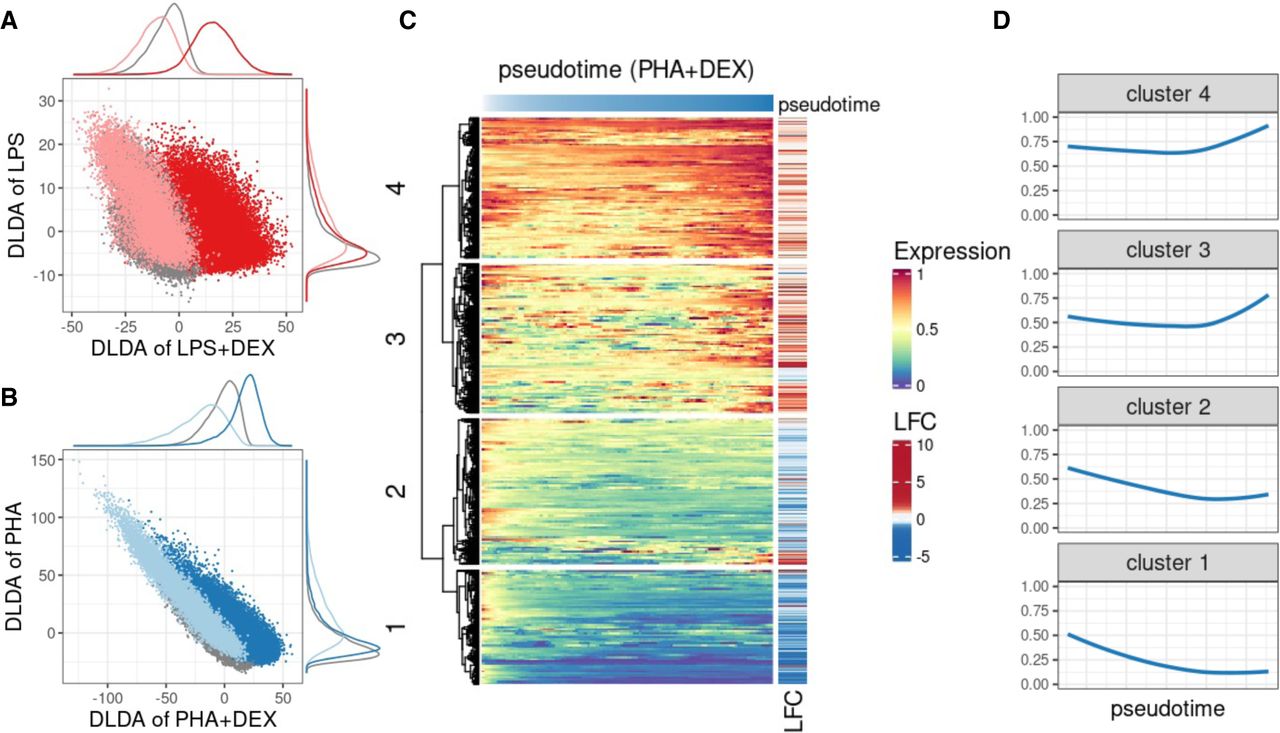
Characterization of dynamic changes along immune response pseudotime. (A) Scatterplot of the DLDA pseudotime for LPS + DEX (x-axis) and the DLDA pseudotime for LPS (y-axis) in T cells. Each dot represents a cell, with the color indicating the treatment condition: gray for unstimulated, pink for LPS, and red for LPS + DEX. (B) Scatterplot of the DLDA pseudotime for PHA + DEX (x-axis) and the DLDA pseudotime for PHA in T cells. Each dot represents a cell, with the color indicating the treatment condition: gray for unstimulated, light blue for PHA, and dark blue for PHA + DEX. (C) Heatmap of relative gene expression for 1617 DEGs (rows) averaged over windows containing 10% of T cells (columns) sliding at a step of 0.1% of T cells along the PHA + DEX response pseudotime. For each gene, gene expression is expressed relative to the highest expression across pseudotime. Red color denotes high expression value, yellow denotes medium expression value, and blue denotes low expression value. The LFC column on the right indicates the LFCs for each DEG between PHA and PHA + DEX. (D) Dynamic patterns of relative gene expression averaged across all genes within each cluster using the same sliding window approach as in C.


