
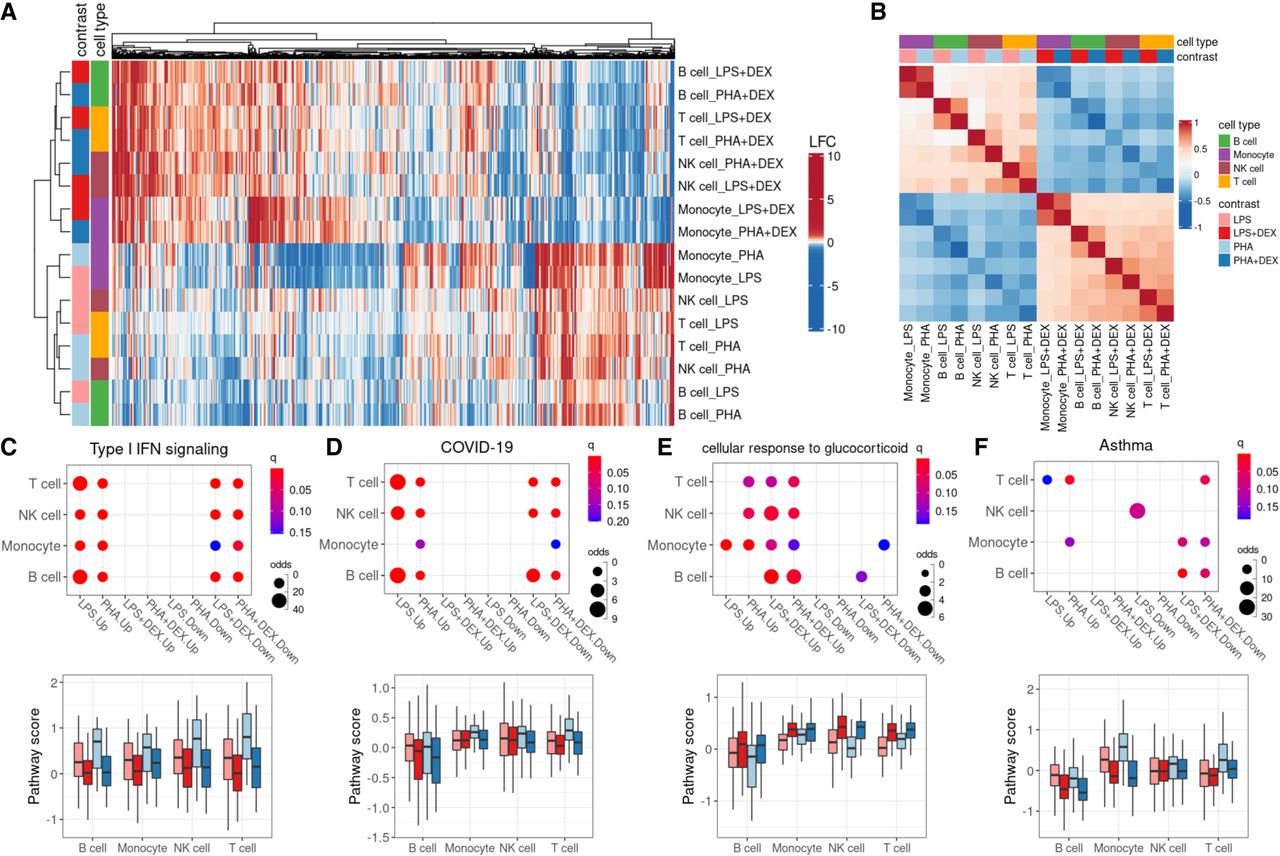
Figure 2.
Identification of differentially expressed genes (DEGs). (A) Heatmap of log2 fold change (LFC) of 6571 DEGs (column) across 16 conditions (four contrasts × four cell types; row). (B) Heatmap of Spearman's correlation of LFC across 16 conditions (four cell types × four contrasts). (C–F) Pathway analysis across cell types and treatment conditions for enrichment in DEG (top) and boxplot for average pathway score (bottom) for four pathways: (C) type I interferon (IFN) signaling, (D) coronavirus disease (COVID-19), (E) glucocorticoid stimulus, and (F) asthma.


