
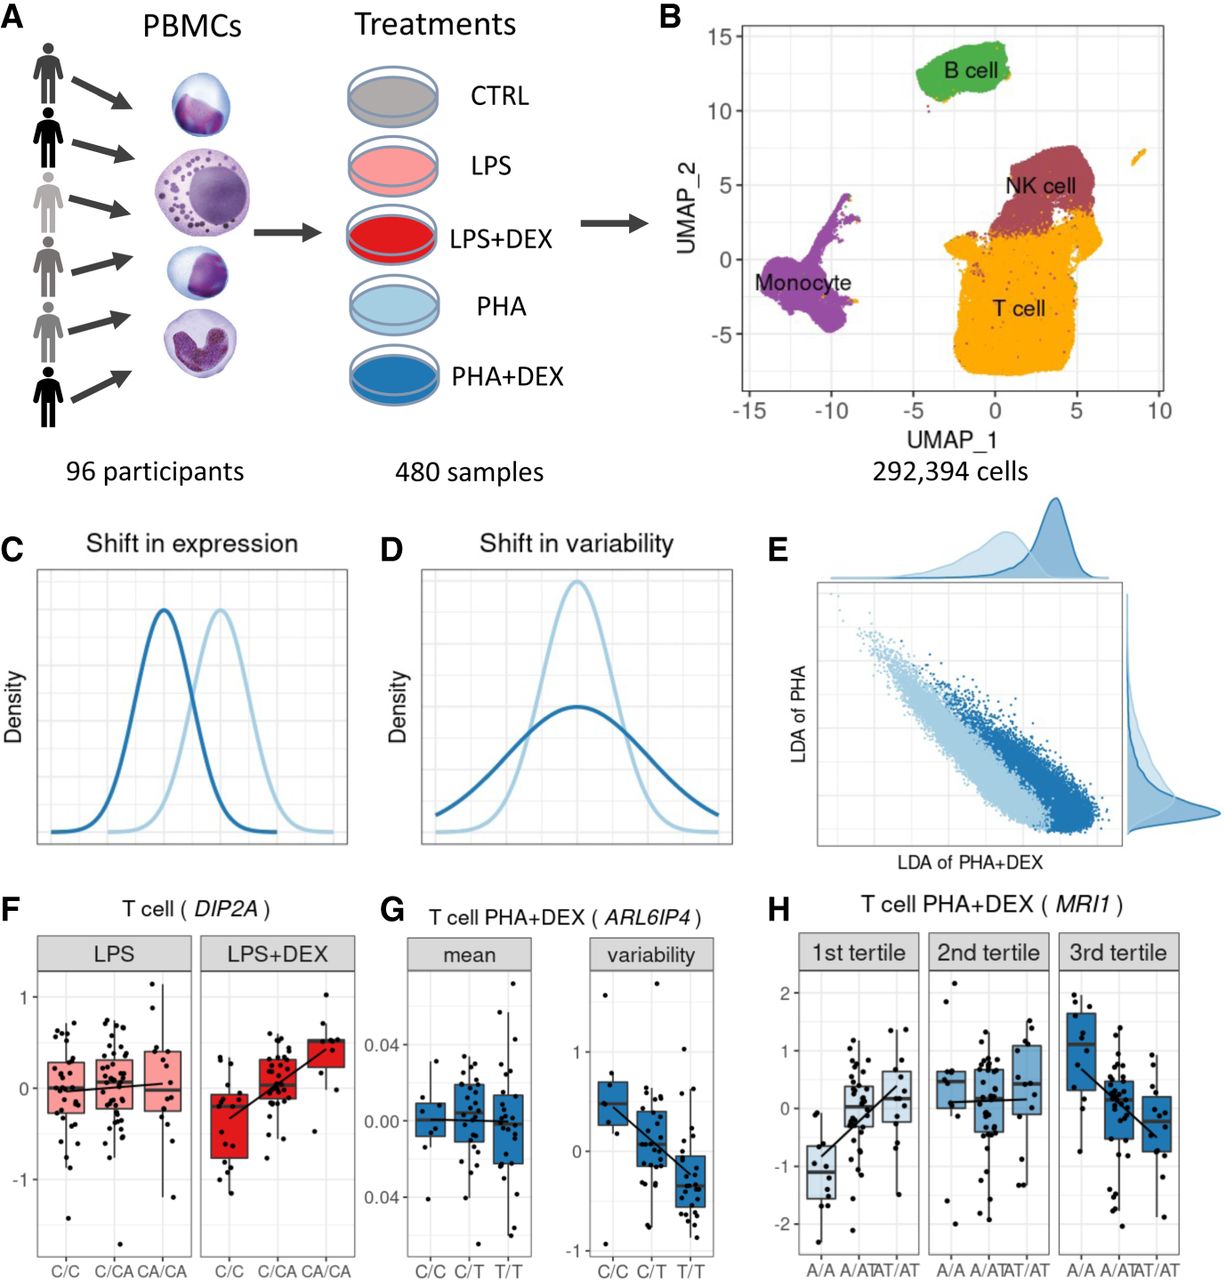
Study overview. (A) PBMCs were collected from 96 African American donors with asthma. Cells were stimulated with phytohemagglutinin (PHA) or lipopolysaccharide (LPS) and treated with glucocorticoid dexamethasone (DEX) for a total of five conditions (including a control), for a total of 480 samples. (B) UMAP visualization of the scRNA data for a total of 293,394 high-quality cells, colored by four major cell types: B cells (green), monocytes (purple), NK cells (maroon), and T cells (orange). (C) Density plot exemplifying changes in mean gene expression between conditions (PHA + DEX vs. PHA). (D) Density plot exemplifying changes in gene variability between conditions (PHA + DEX vs. PHA). (E) Scatterplot representing the low-dimensional manifolds obtained by diagonal linear discriminant analysis (DLDA) in the T cells treated with PHA and PHA + DEX; x-axis denotes the PHA + DEX response pseudotime, and y-axis denotes the PHA response pseudotime. (F) Example of an LPS + DEX response eQTL (reQTL) for DIP2A gene in the T cells. The boxplots depict normalized gene expression levels for the three genotype classes in the two treatment conditions contrasted to identify the reQTL: LPS + DEX (right) and LPS (left). (G) Example of a variability QTL without an effect on the mean gene expression for the ARL6IP4 gene in T cells treated with PHA + DEX. The boxplots depict normalized variability (right) and mean (left) gene expression for the three genotype classes. (H) Example of a DEX response dynamic eQTL for the MRI1 gene in the T cells treated with PHA + DEX.


