
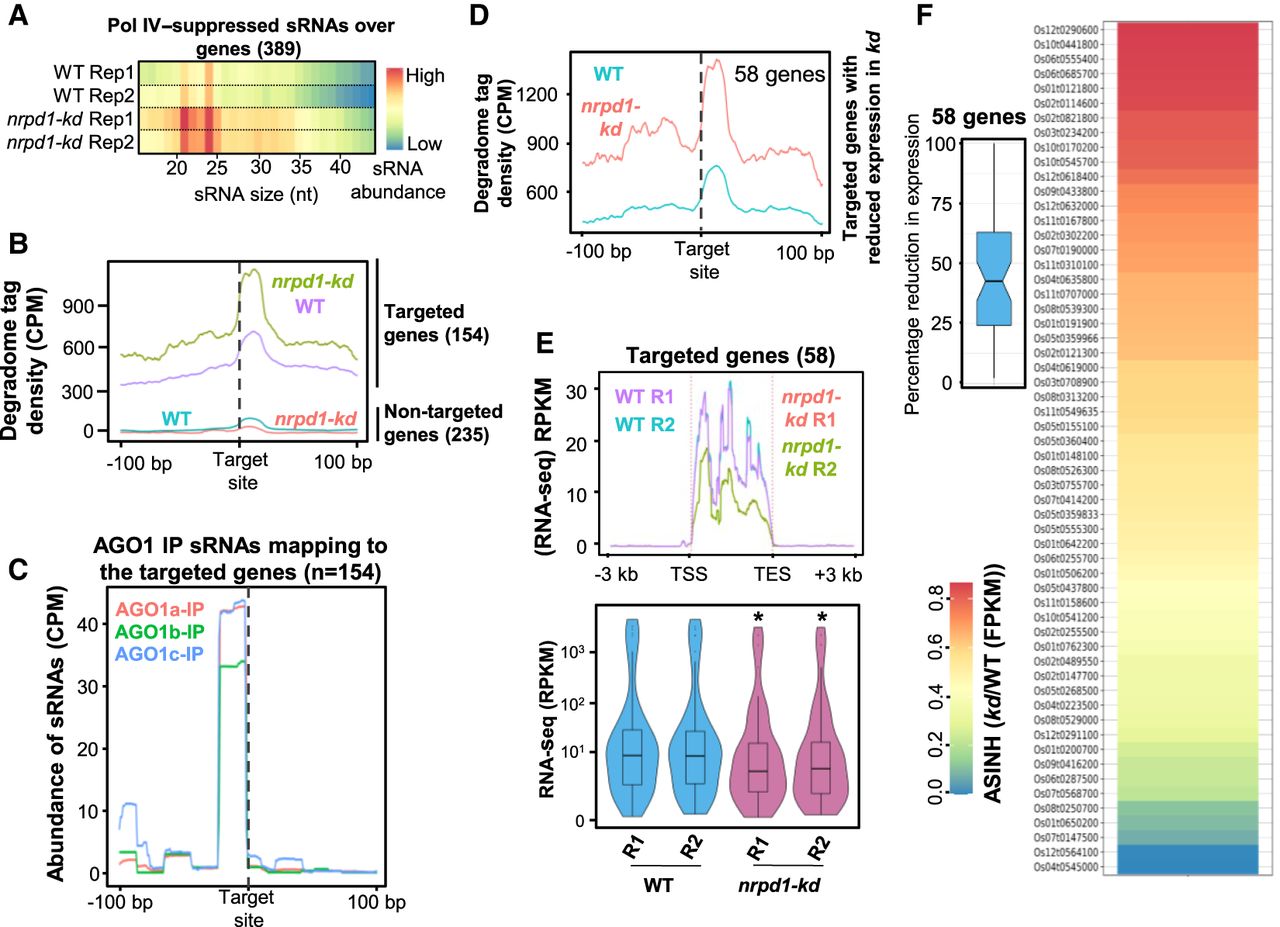
Pol IV–suppressed sRNAs get loaded into AGO1 to mediate PTGS. (A) Heatmaps showing size distribution of sRNAs from Pol IV–suppressed sRNA bins overlapping with genes (389 genes). (B) Metaplots showing the degradome tag density over the genes identified as targets in nrpd1-kd panicle degradome (green and purple; 154 genes) and the same for the genes that are not effectively targeted (category > 5) but produce Pol IV–suppressed sRNAs (cyan and orange; 235 genes). Targeted locations are centered, and 100 bp on either side is displayed. (C) Metaplots showing the abundance of AGO1 IP-enriched sRNAs over the identified targeted genes centered at the targeting site. (D) Metaplots showing the degradome tag density of the 58 genes that showed targeting and significant reduction in expression. (E) Metaplots and box-violin plots showing the expression status of 58 targeted genes described in D. (F) Heatmap showing the fold changes (scaled to inverse sine hyperbolic function) in expression (FPKM) of the 58 genes that showed reduction in expression compared with the WT. The inset boxplot shows the distribution of reduction in expression (FPKM) observed.


