
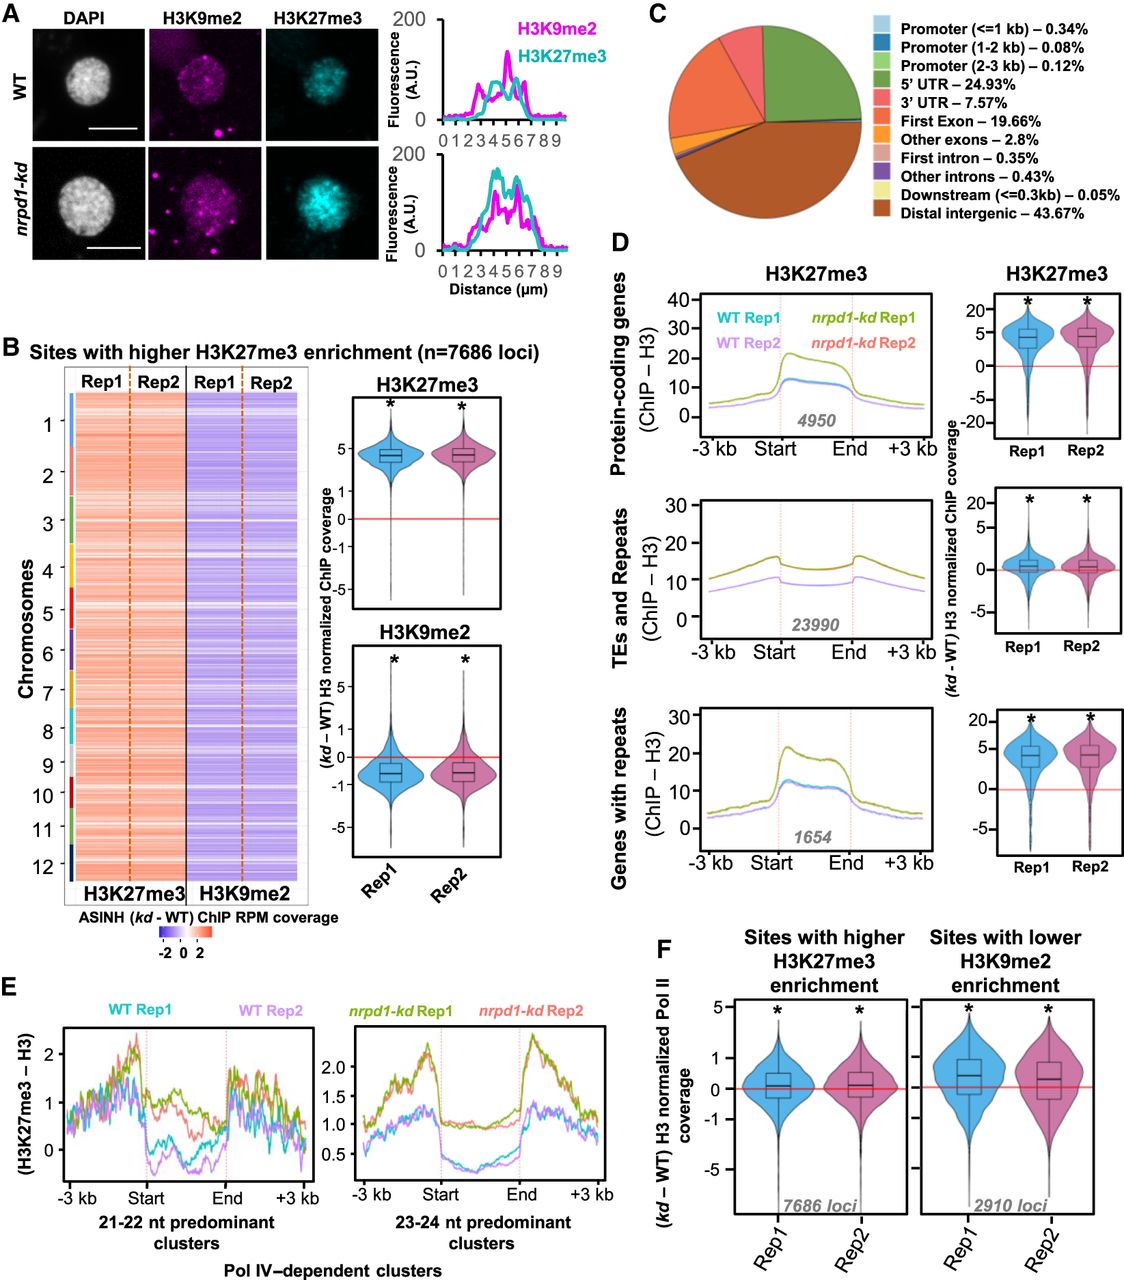
Pol IV maintains the genome-wide distribution of H3K27me3-mediated silencing states. (A) Immunostaining images of H3K27me3 and H3K9me2 marks in the nuclei extracted from WT and kd seedlings. DAPI-stained DNA. Scale bar: 5 µm. At least 30 nuclei from each genotype were examined. Fluorescence signals over the regions of interest are plotted. Regions of interest are also shown in Supplemental Figures S8 and S9. (B) Chromosome-resolved heatmaps showing the levels of difference in H3K9me2 enrichment at sites with higher H3K27me3 enrichment in kd compared with WT. Box-violin plots show the distribution of the differences in H3K9me2 and H3K27me3 levels. The y-axis is scaled to the inverse sine hyperbolic function of differences. (C) Pie chart showing the feature annotation of the sites shown in B. All the sites that do not fall in the ±3-kb windows of genes were categorized as distal intergenic regions. (D) Metaplots showing the levels of H3K27me3 enrichment (normalized to H3) over the annotated features overlapping with the identified H3K27me3 peaks. Numbers in gray depict the number of loci. Box-violin plots show the difference in enrichment in kd compared with the WT. The y-axis is scaled to the inverse sine hyperbolic function of H3 ChIP-normalized values. (E) Metaplots showing the abundance normalized enrichment of H3K27me3 marks w.r.t. H3 over the Pol IV–dependent sRNA clusters size categorized as 21- to 22-nt and 23- to 24-nt predominant clusters. (F) Box-violin plots showing the difference in Pol II coverage over the H3K27me3 higher-enriched sites and H3K9me2 lower-enriched sites in kd compared with the WT. Numbers in gray describe the number of loci taken for analyses. The y-axis is scaled to inverse sine hyperbolic function of enrichment values. (B,D,F) A Mann–Whitney U test was used to test statistical significance against WT Rep1. (*) P-value < 0.0001.


