
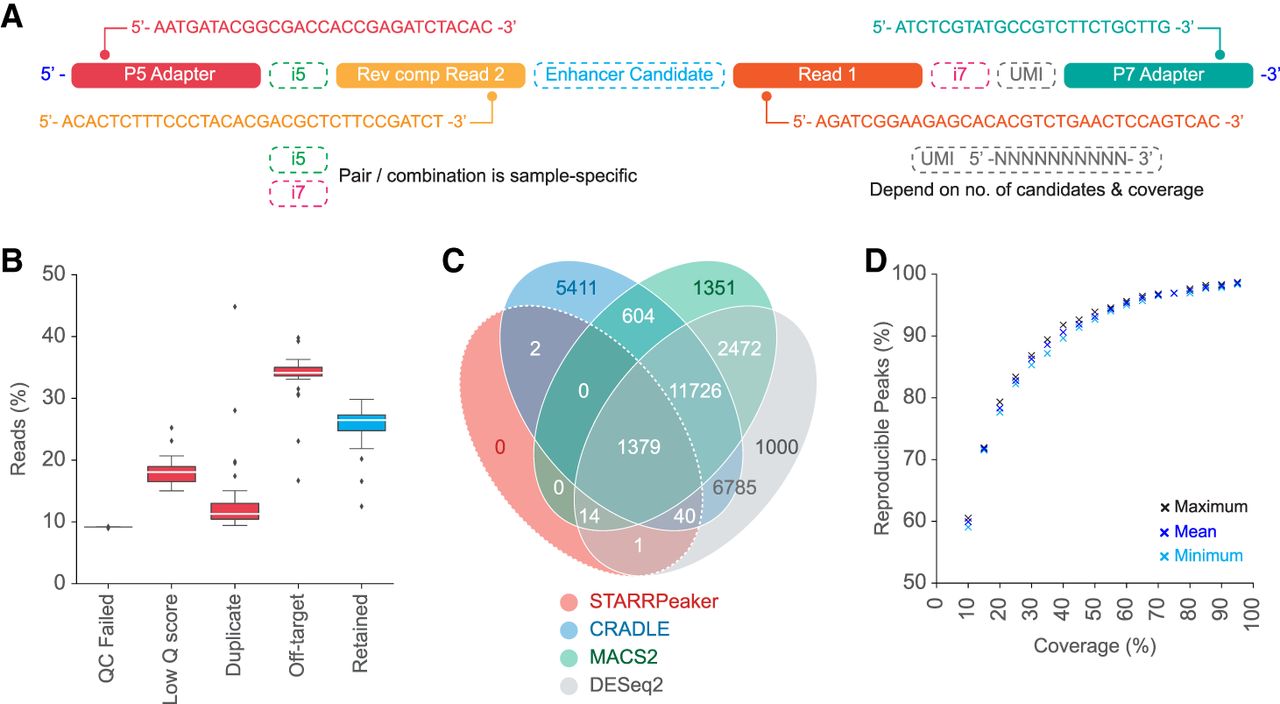
Figure 3.
Read architecture, read depth loss, and peak calling comparisons. (A) Schematic illustrates read architecture of final STARR-seq sequencing library (input and output) before sequencing. (B) Box plots show the percentage of STARR-seq reads retained and those removed owing to various QC filters during analysis of in-house STARR-seq assays. (C) Overlap of STARR-seq peaks identified from the same experiment by four different callers. (D) Percentage of peaks that were reproduced from in-house STARR-seq data set after down-sampling to various coverage thresholds. Analysis details are provided in Supplemental Methods.


