
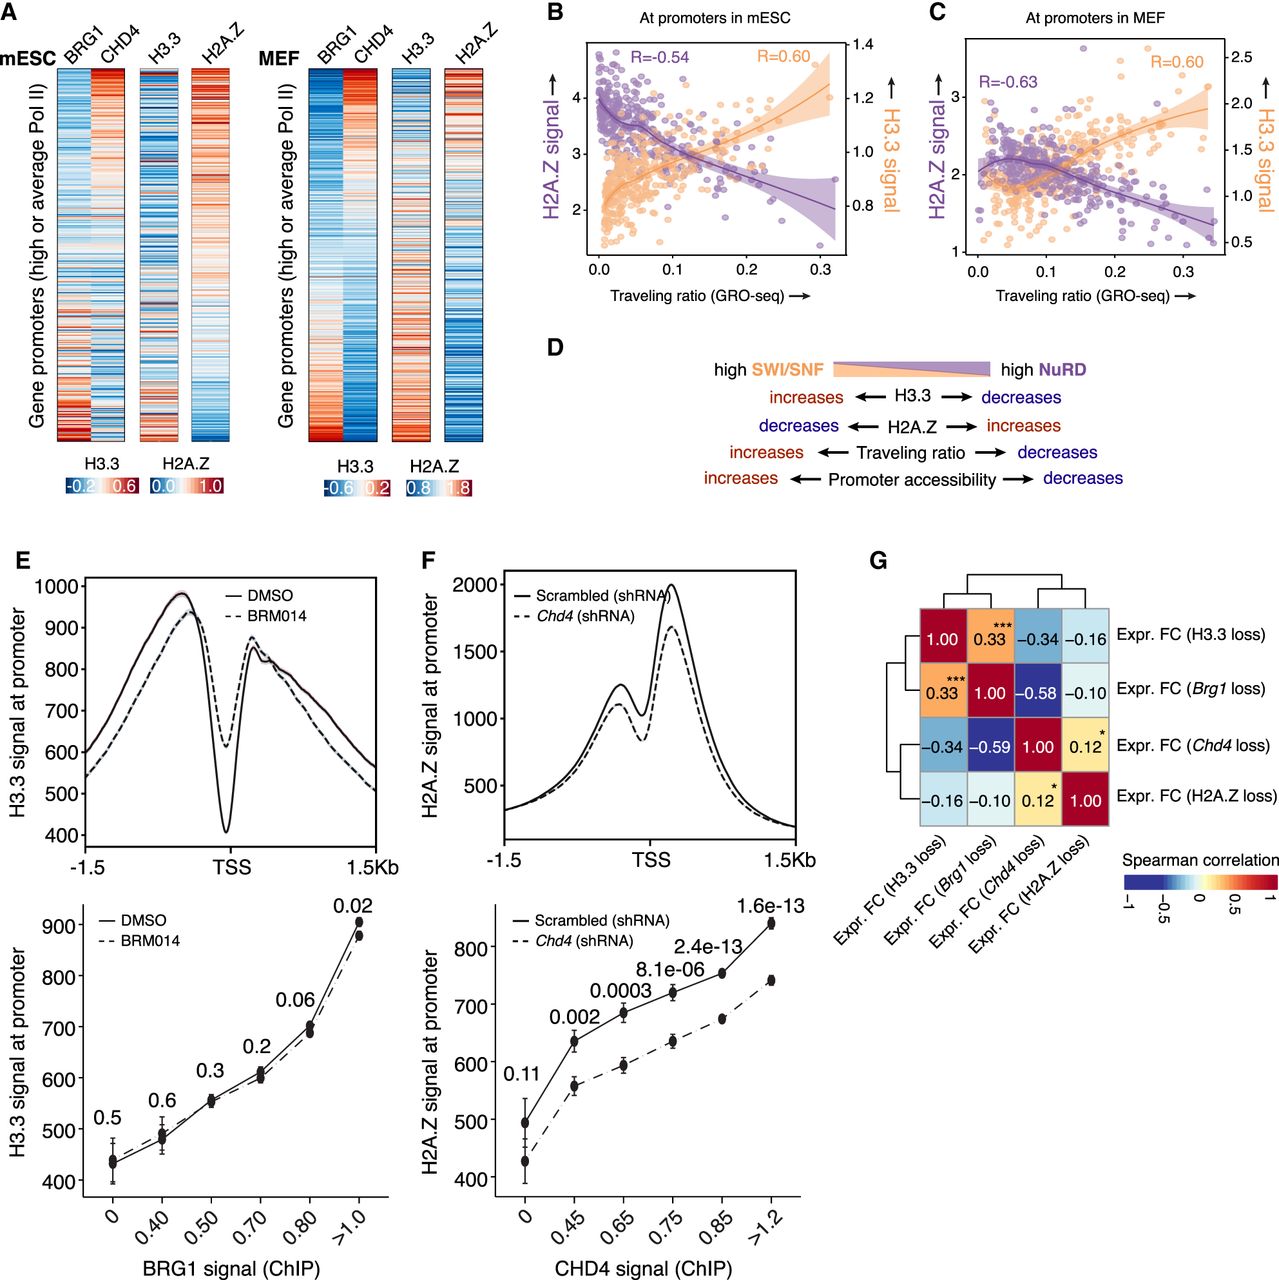
Role of H2A.Z and H3.3 in SWI/SNF- and NuRD-mediated changes in Pol II release kinetics. (A) Genes with average/high Pol II promoter occupancy in mESCs (N = 6387; left) and MEFs (N = 7234; right) are binned into groups of 25 each based on the CHD4 and BRG1 binding ratio at their promoters. For each group, the median CHD4, BRG1, H3.3, and H2A.Z ChIP-seq signals at promoters are shown. (B) Genes (N = 6387) are binned into groups of 25 each based on their Pol II traveling ratio. For each bin, shown are the median H2A.Z and H3.3 levels (Loess regression lines are included). (C) Genes with average/high Pol II promoter occupancy in MEFs (N = 7234) are binned into groups of 25 each based on their Pol II traveling ratio. For each bin, shown are the median H2A.Z and H3.3 levels (Loess regression lines are included). (D) Schematic diagram showing the relationship between SWI/SNF and NuRD occupancy levels with Pol II traveling ratio, DNA accessibility, and H3.3 and H2A.Z levels at gene promoters. (E) Changes in H3.3 levels at promoters in mESCs upon inhibiting BRG1 activity using BRM014 (top). Genes (N = 6387) are binned based on BRG1 occupancy levels in mESCs. For each bin, the H3.3 levels in WT and BRG1 inhibitor-treated mESCs are shown (bottom). (F) Same as E but showing the changes in H2A.Z levels in Chd4 KD mESCs compared with a scrambled control. (G) Hierarchical clustering (based on Spearman's rank correlation) of the gene expression profiles of Chd4 KD, Brg1 KD, H2A.Z-depleted, and H3.3-depleted mESCs. P-values: (***) <0.001, (*) <0.05.


