
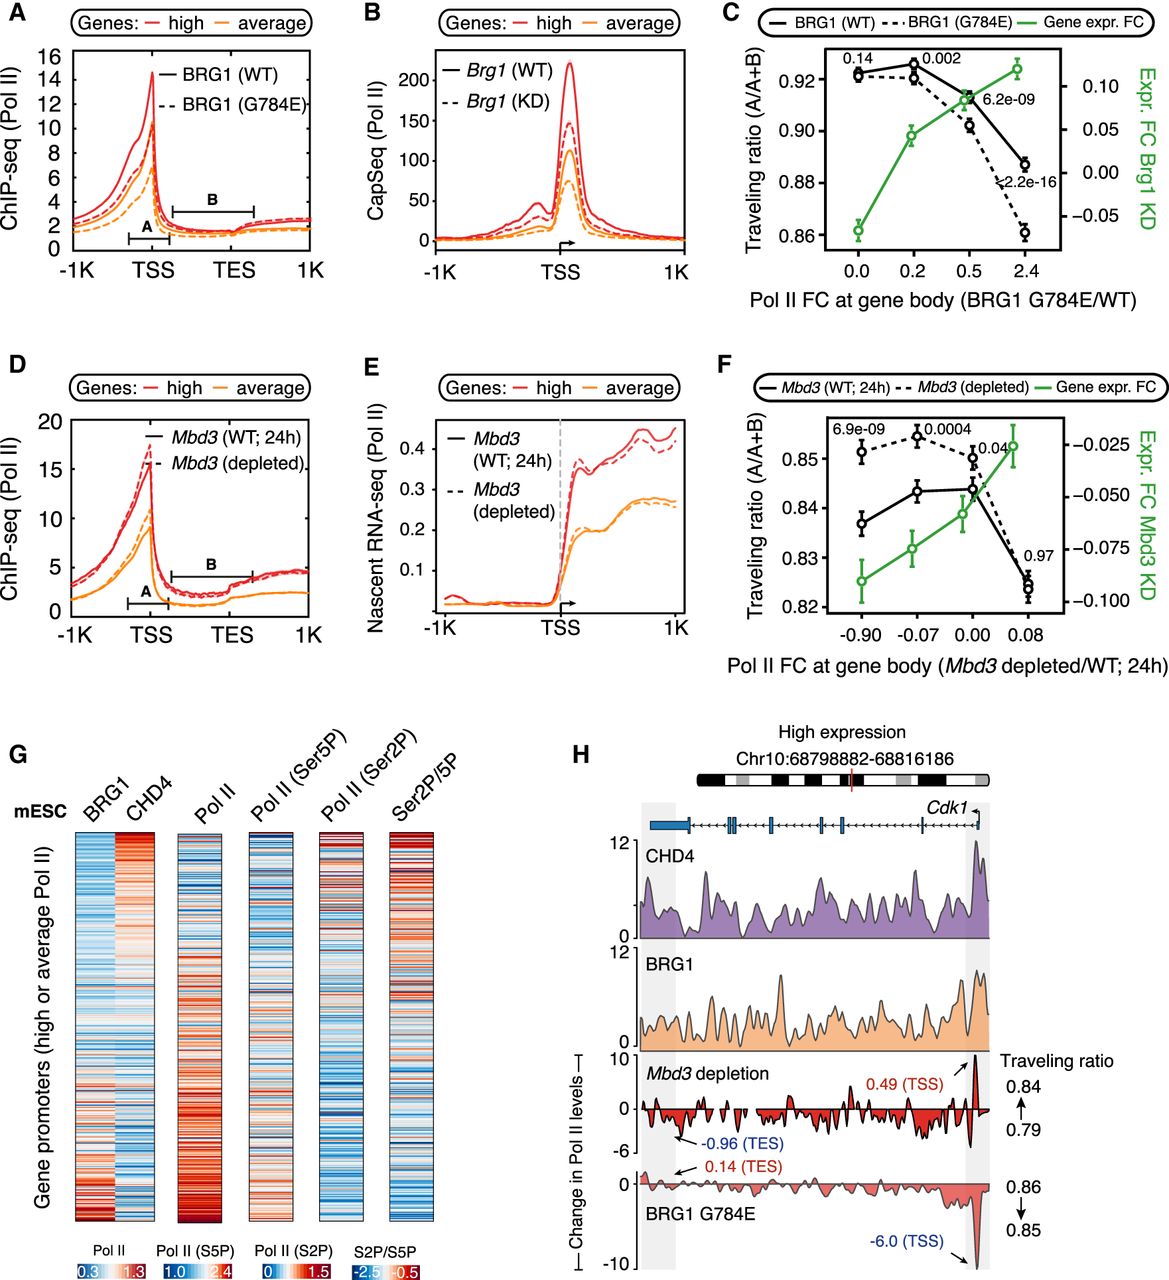
Differential effects of SWI/SNF and NuRD on RNA Pol II release kinetics at promoters of average/high Pol II–bound genes. (A,B) Changes in Pol II occupancy (A) and nascent RNA levels (B) at promoters (N = 6387) upon loss of BRG1 activity. Standard error is represented by a shaded area around the lines. (C) Genes with average/high Pol II promoter occupancy in mESCs (N = 6387) are binned into four groups (1597 genes each) based on the changes in the levels of Pol II released into the gene body upon loss of BRG1 activity (x-axis). For each bin, the changes in traveling ratio (solid vs. dashed black lines) and gene expression (green line) upon loss of BRG1 activity are shown (Wilcoxon rank-sum test, two-sided). (D–F) Same as A–C but following Mbd3 loss. (G) Genes (N = 6387) are binned into groups of 25 each based on the CHD4 and BRG1 binding ratio at their promoters. For each group, the median occupancy levels of initiating (Ser5p) and elongating (Ser2p) Pol II forms are shown. (H) Genome browser view for Cdk1, where loss of BRG1 activity leads to a decrease in Pol II promoter occupancy. The opposite is observed following Mbd3 depletion.


