
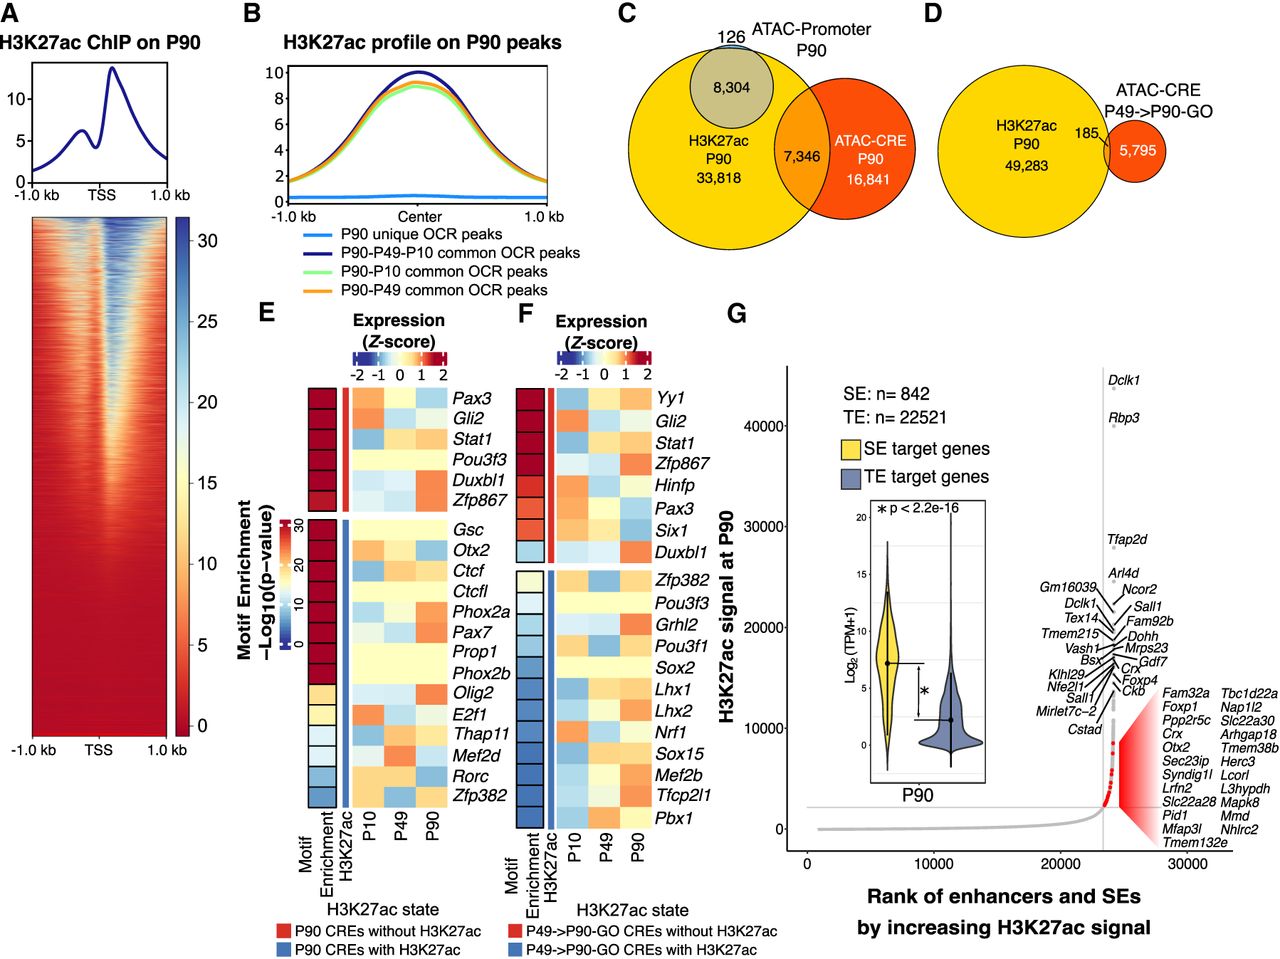
Catalog of PB-related enhancers and super-enhancers (SEs). (A) Aggregated signal and heatmap of P90 H3K27ac ChIP-seq over the TSS of expressed genes showing the expected bimodal profile. (B) Aggregated P90 H3K27ac ChIP-seq signal at P90 unique and common OCRs to P90. (C,D) Venn diagrams showing the overlap between P90 OCRs at promoters and CREs for P90 H3K27ac ChIP-seq peaks and the overlap between P49 → P90-GO CREs and P90 H3K27ac peaks. (E, left) Bar indicates TF motif enrichment in P90 CREs. (Right) Heatmap represents Z-score normalized mean expression values of the corresponding TFs at P10, P49, and P90. (F) P49 → P90-GO CRE peaks were split into those marked with H3K27ac (blue) and those without (red). TF motifs enrichment was performed on each category (left bar). Heatmaps of normalized gene expression for each TF is also shown. (G) H3K27ac peaks at P90 were ranked by ROSE2 to identify TE and SE. Annotated dots correspond to the top 25 identified SEs and PB-specific SEs (red dots). Inset represents violin plots for the normalized expression levels of SE (yellow) and TE (blue-gray) gene targets.


