
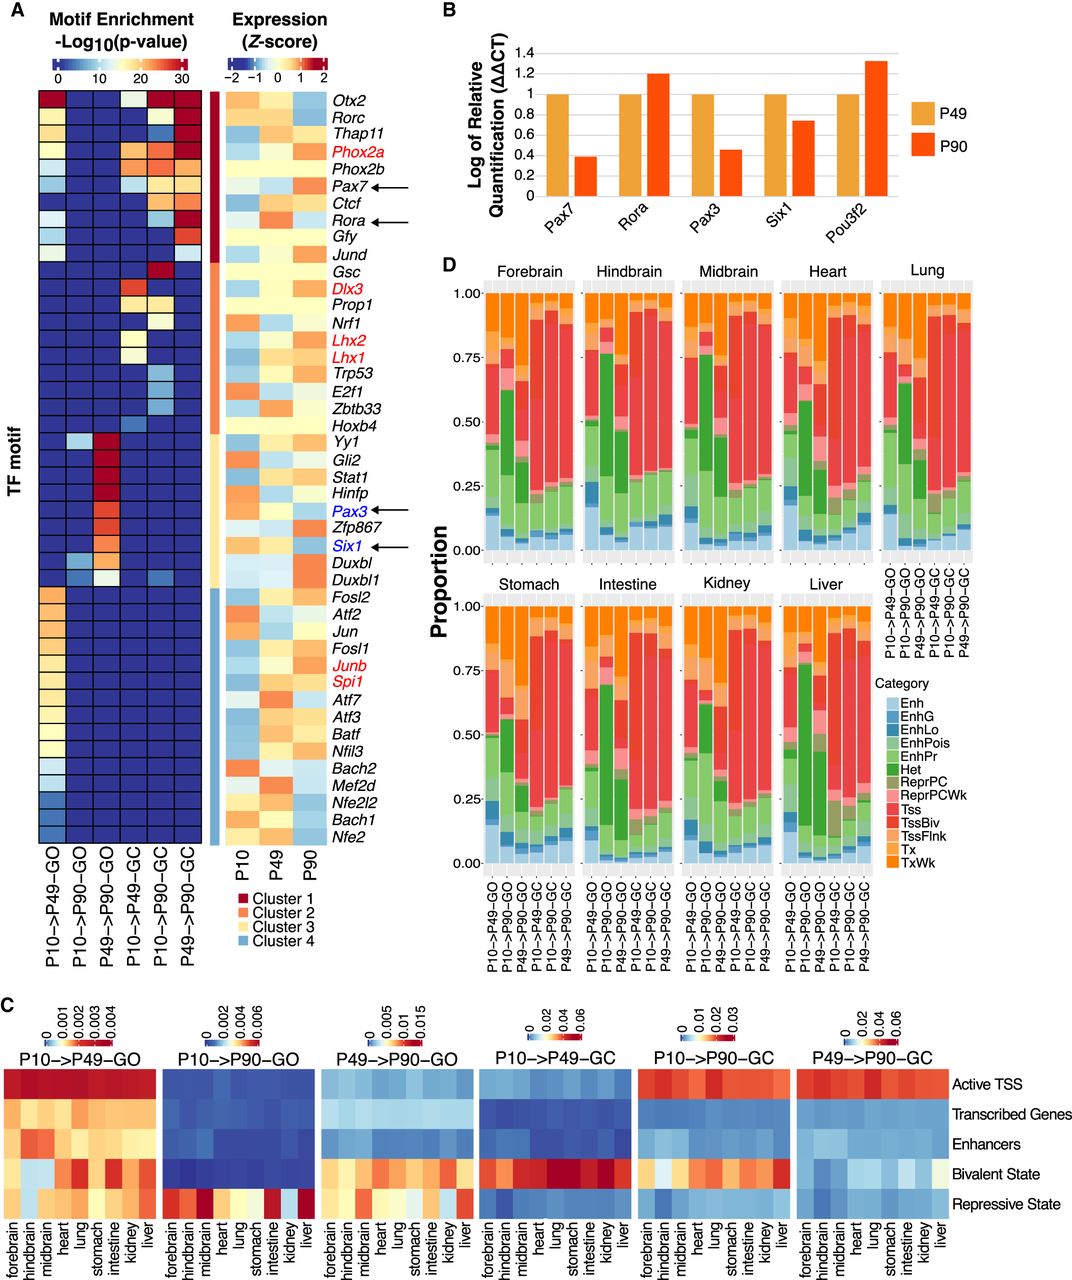
Temporal dynamics of PB genomic accessibility profiles revealing clusters of time point–specific putative transcriptional regulators. (A, left) Heatmap of TF motifs enriched in different GO and GC OCR groups. (Right) Z-score normalized mean expression values of the corresponding TFs at P10, P49, and P90. Red and blue fonts depict differentially up- and down-regulated TF between P10 and P90, respectively. Arrows indicate the list of genes tested by RT-qPCR. (B) RT-qPCR validation for a select list of genes from panel A and from Supplemental Figure S4D (for Pou3f2). (C) Heatmaps of Jaccard indices for the six GO and GC OCR groups in nine ChromHMM annotated mouse tissues from ENCODE (Supplemental Methods) with respect to five ChromHMM categories. (D) Proportion of overlap between each of the GO and GC OCR groups and ChromHMM subcategories. The stacked bar plot shows that P10 → P90−GO and P49 → P90−GO categories have the highest overlap with Heterochromatin state regions (dark green).


