
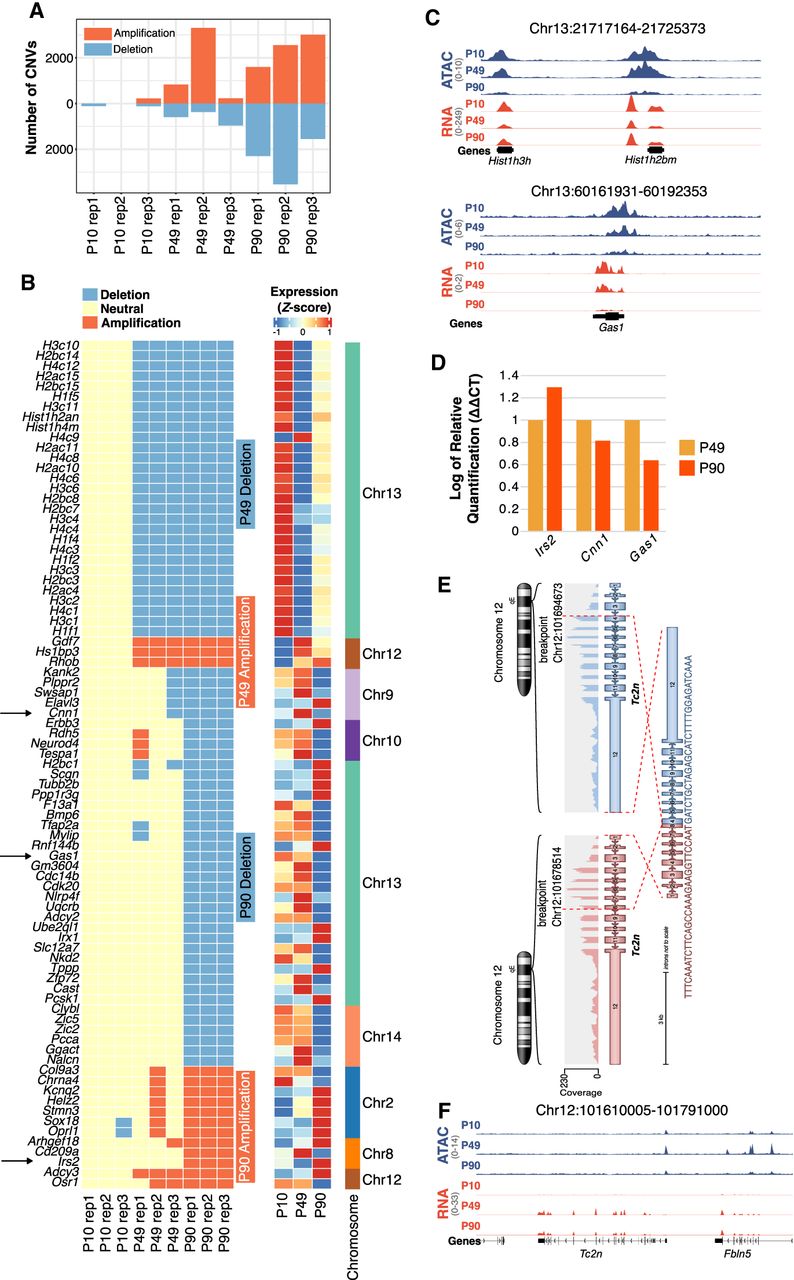
PB is marked by a progressive increase of DNA structural variants. (A) Bar plot highlighting the number of gene amplification (red bars) and deletions (blue bars) for each of the three biological replicates at P10, P49, and P90 time points. (B, left) Heatmap indicating the deletion (blue) and amplification (red) events common between all biological replicates at P49 and/or P90 and associated with differential gene expression of the implicated genes. (Right) Z-score normalized mean expression profiles of the predicted deleted or amplified genes. Rightmost bar indicates the chromosome where the deletion or amplification event took place. Arrows indicate genes that were tested by RT-qPCR. (C) Genomic tracks of normalized RNA-seq and ATAC-seq profiles showing differential down-regulation and decreased accessibility of histone genes H3c10 and H2bc14 and Gas1 in line with predicted deletion events at P49 and P90, respectively. (D) RT-qPCR on three different genes validating the observation from 4B. (E) Graphical representation as plotted by Arriba (Uhrig et al. 2021) of Tc2n-Tc2n tandem duplication in a P90 biological replicate. (F) Genomic tracks of normalized RNA-seq and ATAC-seq profiles of Tc2n showing differential up-regulation of Tc2n at P49 and P90 in comparison to P10.


