
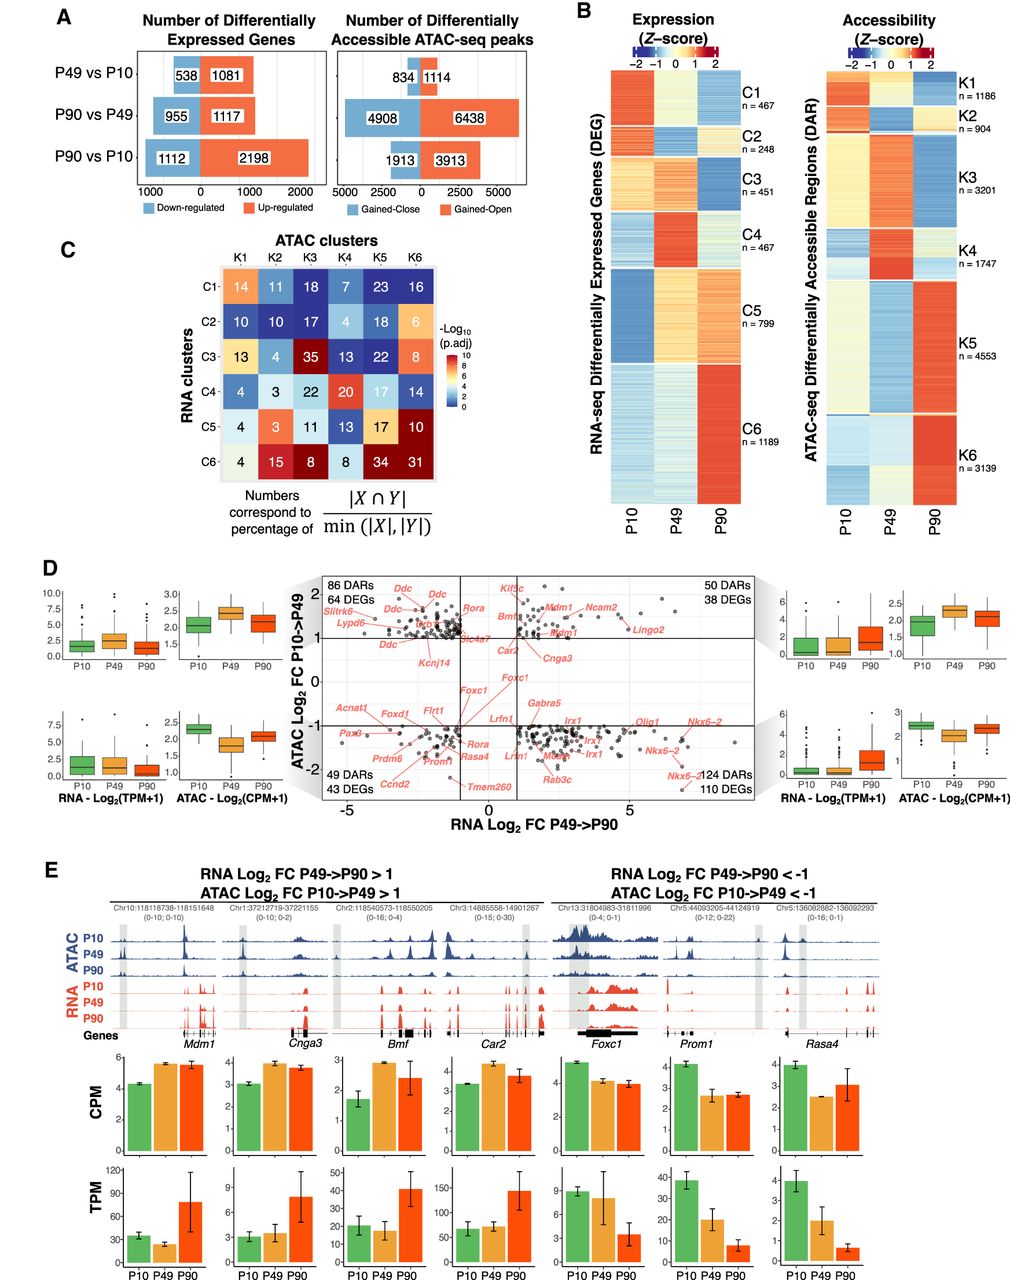
A temporal functional relationship between the regulatory genome and the transcriptome in PB. (A) The number of differentially expressed genes (DEGs; left) and differentially accessible regions (DARs; right) between pairwise time point comparisons. (B) Heatmaps of normalized values (Z-scores) of DEGs (left) and DARs (right). Unsupervised hierarchical clustering segregates the two heatmaps into six clusters each. Numbers underneath cluster names indicate the corresponding number of rows. Target genes of rows in the accessibility heatmap do not match with genes from the expression heatmap. (C) Heatmap with numbers representing the proportion of overlap between OCRs target genes in each DAR cluster (columns; clusters K1 to K6) and genes in each DEG cluster (rows; clusters C1 to C6) using the indicated formula. Color scale represents −log10 of Bonferroni-corrected P-values for the hypergeometric test. (D) Scatter plot for all genes differentially expressed between P49 and P90 and their associated DARs. The plot shows all combinations of cases in which a gene is differentially regulated at P90, whereas its regulatory region is differentially gained or closed earlier, at P49. For each quadrant, the boxplots show, for all gene-regulatory element associations, the distribution of gene expression and of ATAC signal for the accessible elements. (E) Selection of genomic tracks of normalized RNA-seq and ATAC-seq profiles showing expression and accessibility levels for four DARs gained open at P49 as their target genes are up-regulated at P90 and for three DARs gained closed at P49 as their target genes are down-regulated at P90. Loci coordinates are indicated in gray with the y-axis scales of both assays in parenthesis (ATAC-seq; RNA-seq). The CPM and TPM values for the highlighted peaks and their target genes are shown in the bar plots below. Error bars represent standard deviations from the biological replicates.


