
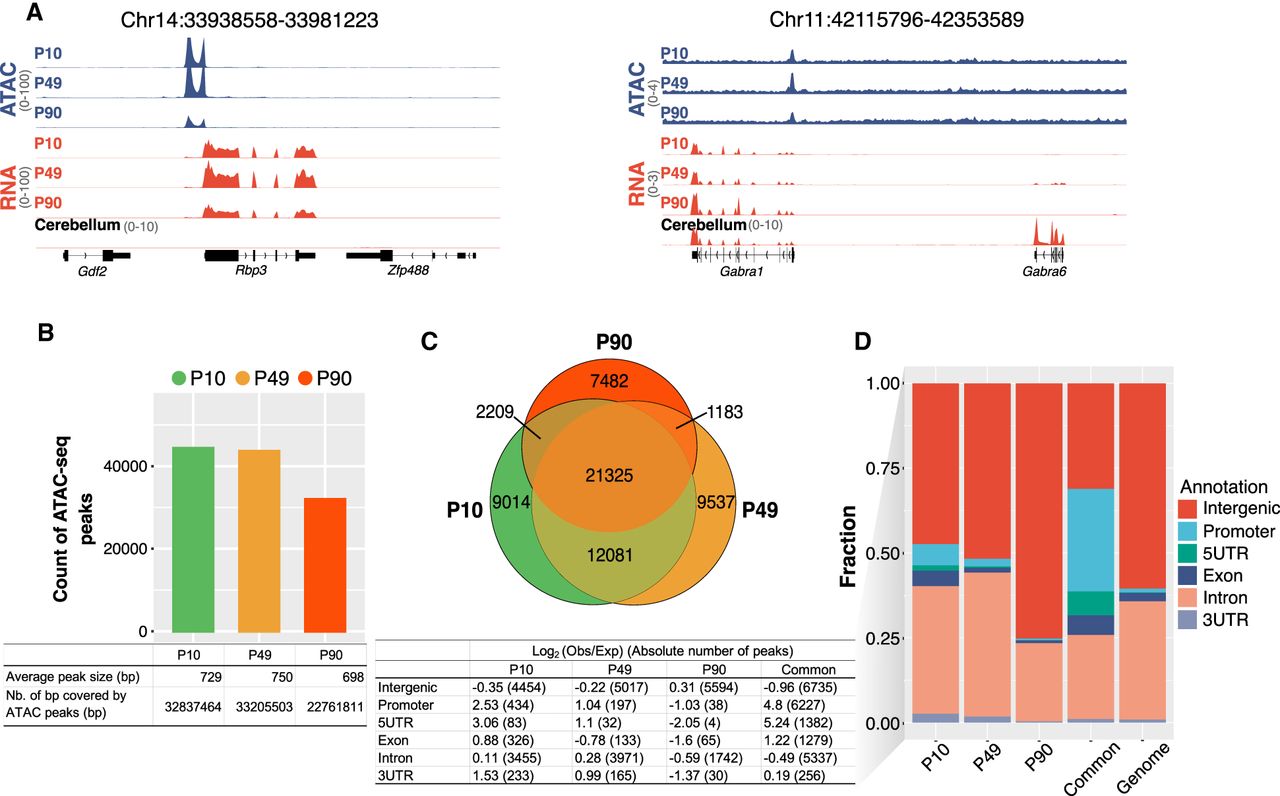
An atlas of PB transcriptome. (A) Genomic tracks of normalized RNA-seq and ATAC-seq profiles for representative loci showing the high expression of Rbp3 specific to pineal tissues (left) and Gabra6 specific to cerebellar tissues (right). Loci coordinates are indicated above. The y-axis scales for both assays are shown in parentheses. (B) Bar plot showing the number of ATAC-seq peaks called at each time point. The table below shows the average peaks size and the peak genome coverage in base pairs. (C) Venn diagram for the number of overlapping OCRs between the three time points. (D) Genomic loci annotation for unique and common OCRs at each time point highlighting the large fraction of intergenic OCRs at P90, whereas common peaks are enriched for promoter OCRs. The genome distribution of the same elements is shown for comparison. The associated table shows the log2 fold change of observed/expected and the absolute number of OCRs between parentheses. Note the increase in the fold change for intergenic elements during progression from P10 to P90 accompanied by a decrease in the log fold change for promoter.


