
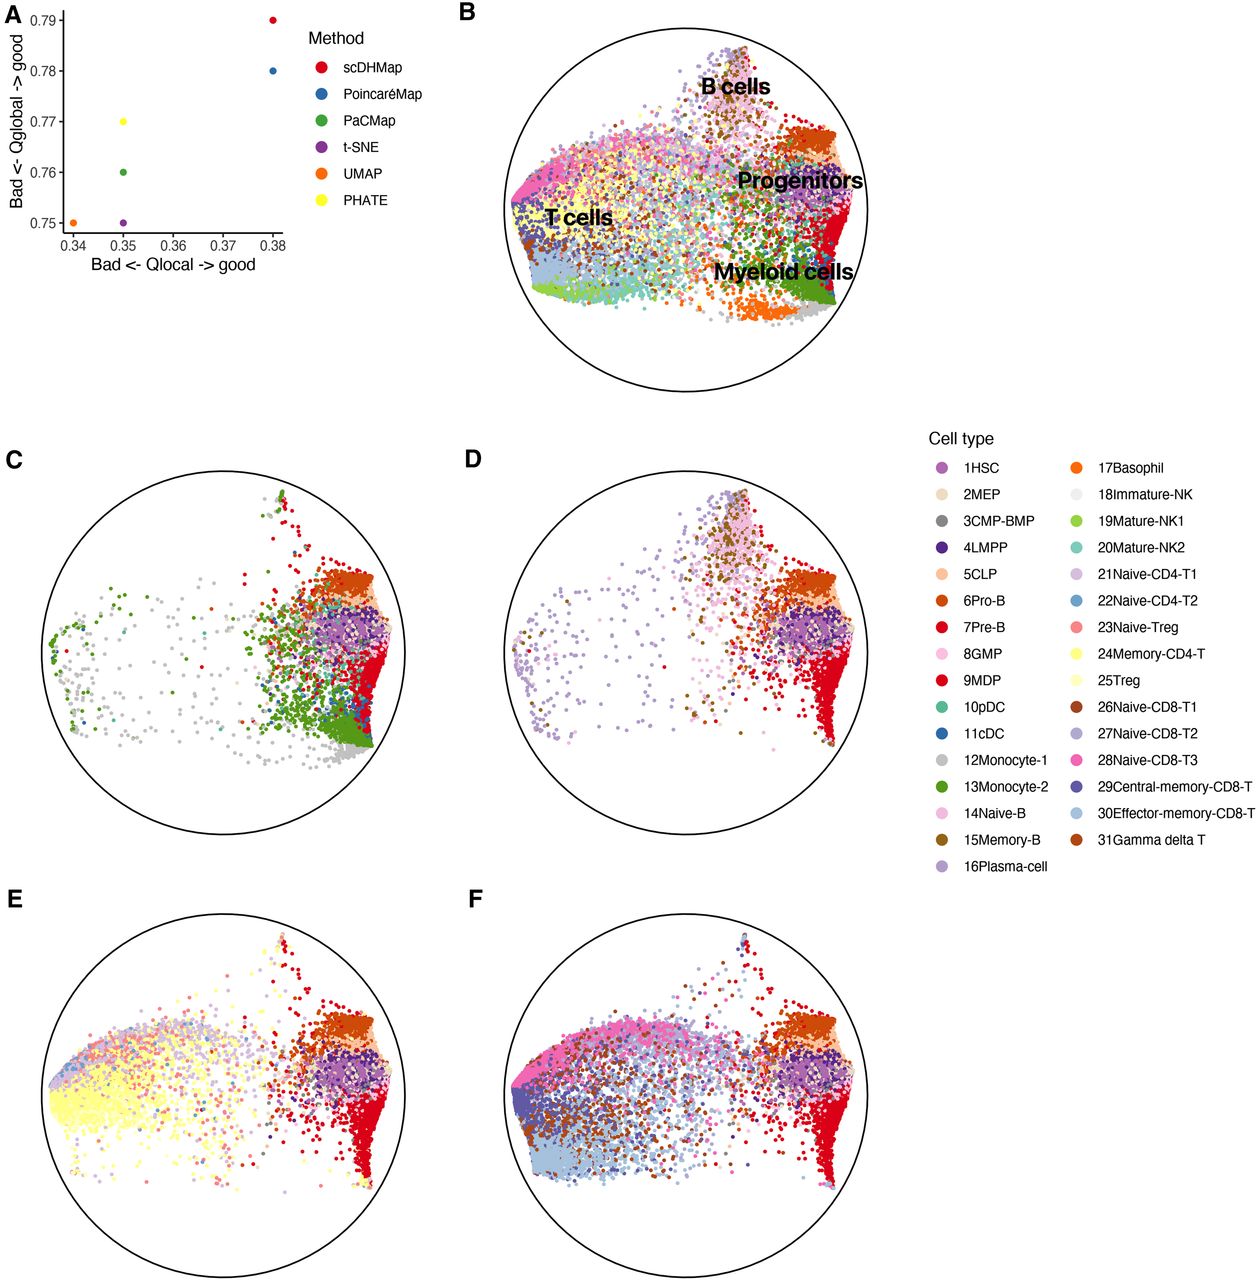
Figure 6.
Embedding of scDHMap on Satpathy's scATAC-seq data. (A) Embedding quality metrics of different methods. (B) scDHMap embedding of Satpathy's scATAC-seq data. (C–F) scDHMap embedding of different cell types. (C) Progenitor cells (cluster 1–9) and myeloid cells (cluster 10–13). (D) Progenitor cells and B cells (cluster 14–16). (E) Progenitor cells and CD4+ T cells (cluster 21–25). (F) Progenitor cells and CD8+ T cells (cluster 26–31). (HSC) Hematopoietic stem cell; (LMPP) lymphoid-primed multipotent progenitor; (CLP) common lymphoid progenitor; (MEP) megakaryocyte–erythroid progenitor; (BMP) basophil–mast cell progenitor.


