
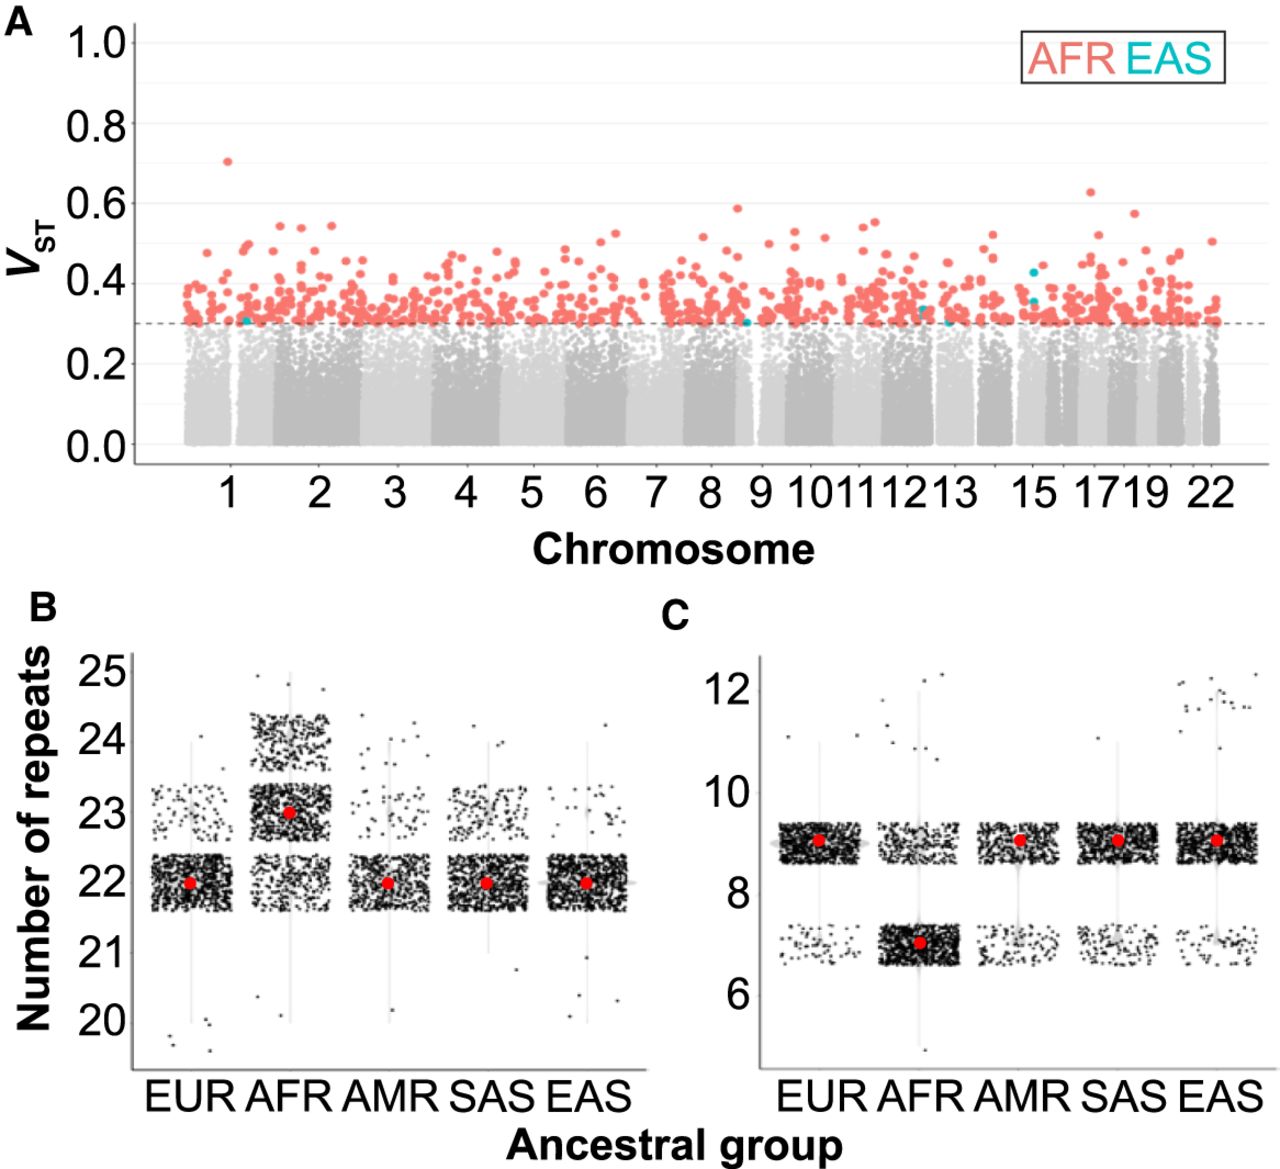
Population stratification of fm-mSTRs. (A) Manhattan plot showing the highest VST index for 126,676 polymorphic STRs across the five tested superpopulations. For each STR and ancestry, VST index was calculated using the individual allele size. VST values are color-coded according to ancestry when VST > 0.3 (gray dashed line). (B,C) The allele size distribution for di- and pentanucleotide STRs located at the promoter and 5′ UTR regions of the CLEC17A (B; Chr 19: 14,582,958–14,582,997) and CRYBB2P1 (C; Chr 22: 25,448,062–25,448,099) genes, respectively. For each ancestral group, median of allele size is depicted by red dot. (EUR) European, (AFR) African, (AMR) American, (SAS) South Asian, (EAS) East Asian.


