
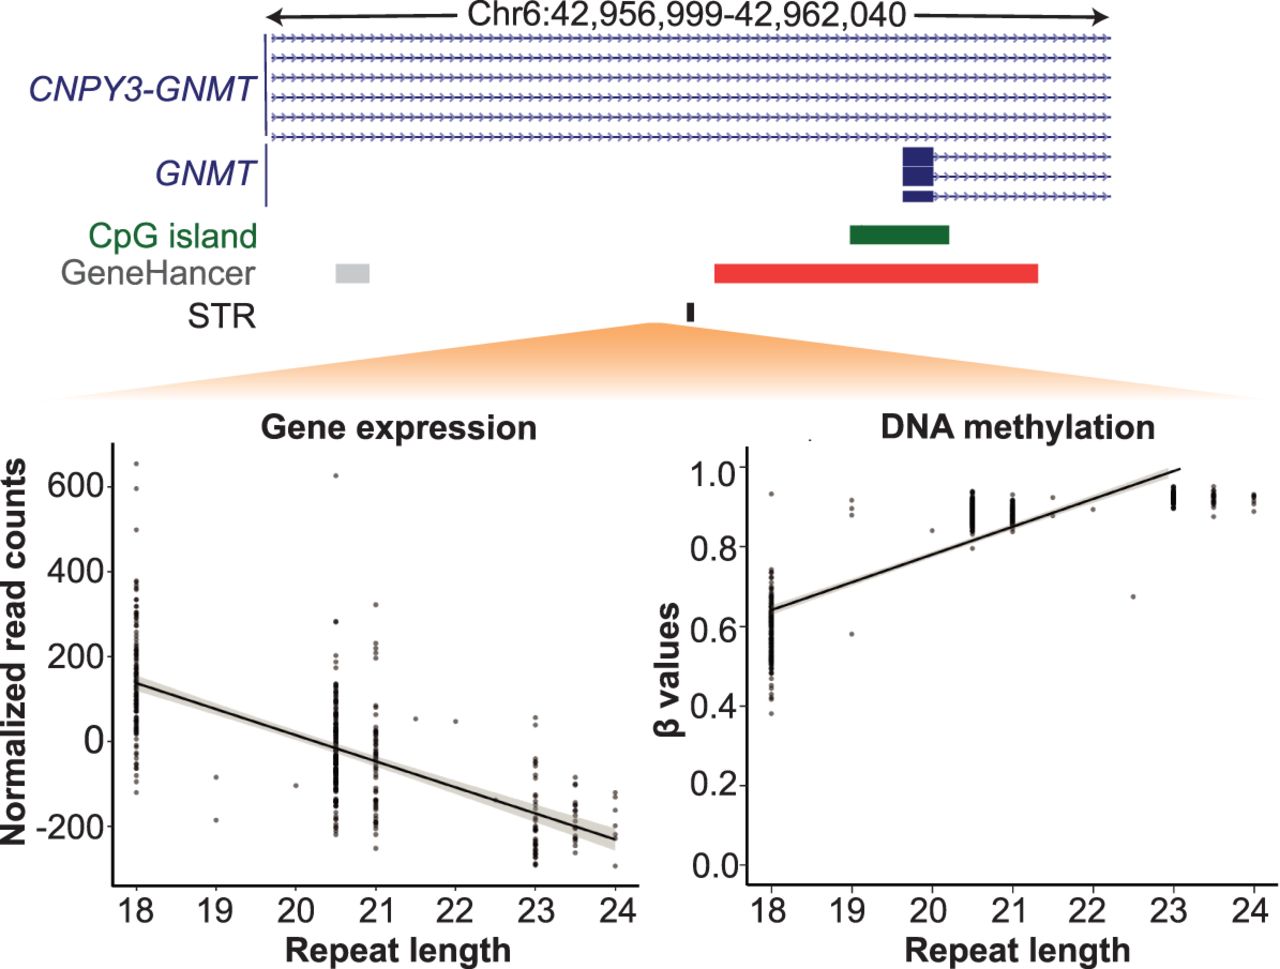
Figure 5.
STR-directed DNA methylation leads to changes in gene expression levels of target genes. Scatter plots showing opposite correlation between the length of an AG repeat (Chr 6: 42,959,499–42,959,540) with the expression (left plot) and promoter DNA methylation (right plot) of the GNMT gene. Each dot represents data from one individual of the PPMI cohort, whereas the diagonal line represents the best-fit for all data points. Genomic locations of the STR (black), gene (blue), CpG islands (dark green), promoter (red), and enhancers (gray) are shown above the plots for the interval Chr 6: 42,956,999–42,962,040 (hg38).


