
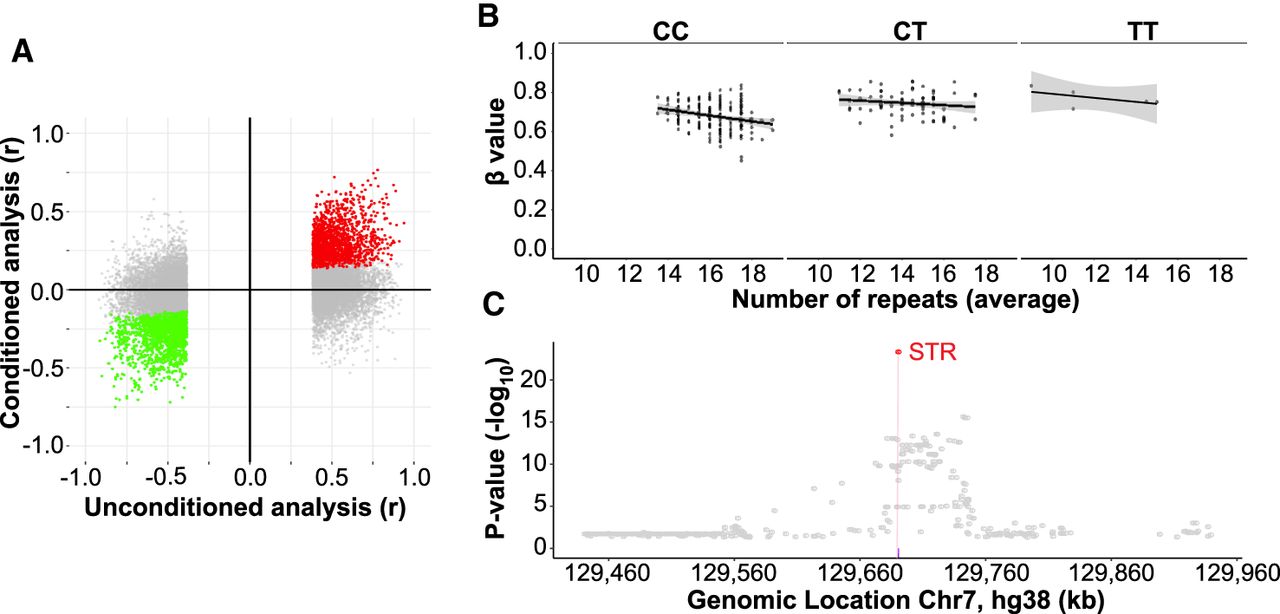
Genetic fine-mapping of mSTRs. (A) Comparison between results obtained with and without conditioning association tests for the lead associated SNV. Red (positive) and green (negative) dots represent individual STR:CpG associations that retain the same directionality and remain significant (P < 0.05) upon conditioning for the lead SNV. Conversely, gray dots represent STR:CpG associations that either became nonsignificant or show opposite directionality after conditioning, suggesting that the STR is not the causal variant at the locus. (B) An example of a conditional analysis for the STR located at the intronic region of KLHDC10 (Chr 7: 130,090,768–130,090,795). Scatter plots showing resulting associations between the methylation levels (β-values) of the mSTR-target CpG (probe ID cg09813917) and STR allele size for samples that were homozygous for the major allele (left) or were heterozygous (middle), and homozygous samples for the minor allele (right) of the lead SNV (rs4731662, Chr 7: 130,142,537). Upon conditioning for this SNV, the association of STR with methylation level retains the same directionality and remains significant (P < 0.05), suggesting that the STR acts as an independent regulator of methylation. (C) Regional Manhattan plot showing genetic associations (−log10 P-values; y-axis) against chromosome position (x-axis) for the Chr 7: 130,090,768–130,090,795 mSTR (red) and SNVs located within ±250 kb with methylation levels of the cg09813917 CpG probe. Across all the tested variants, the mSTR shows the strongest association and is predicted by CAVIAR to be the causal variant with 99% probability.


