
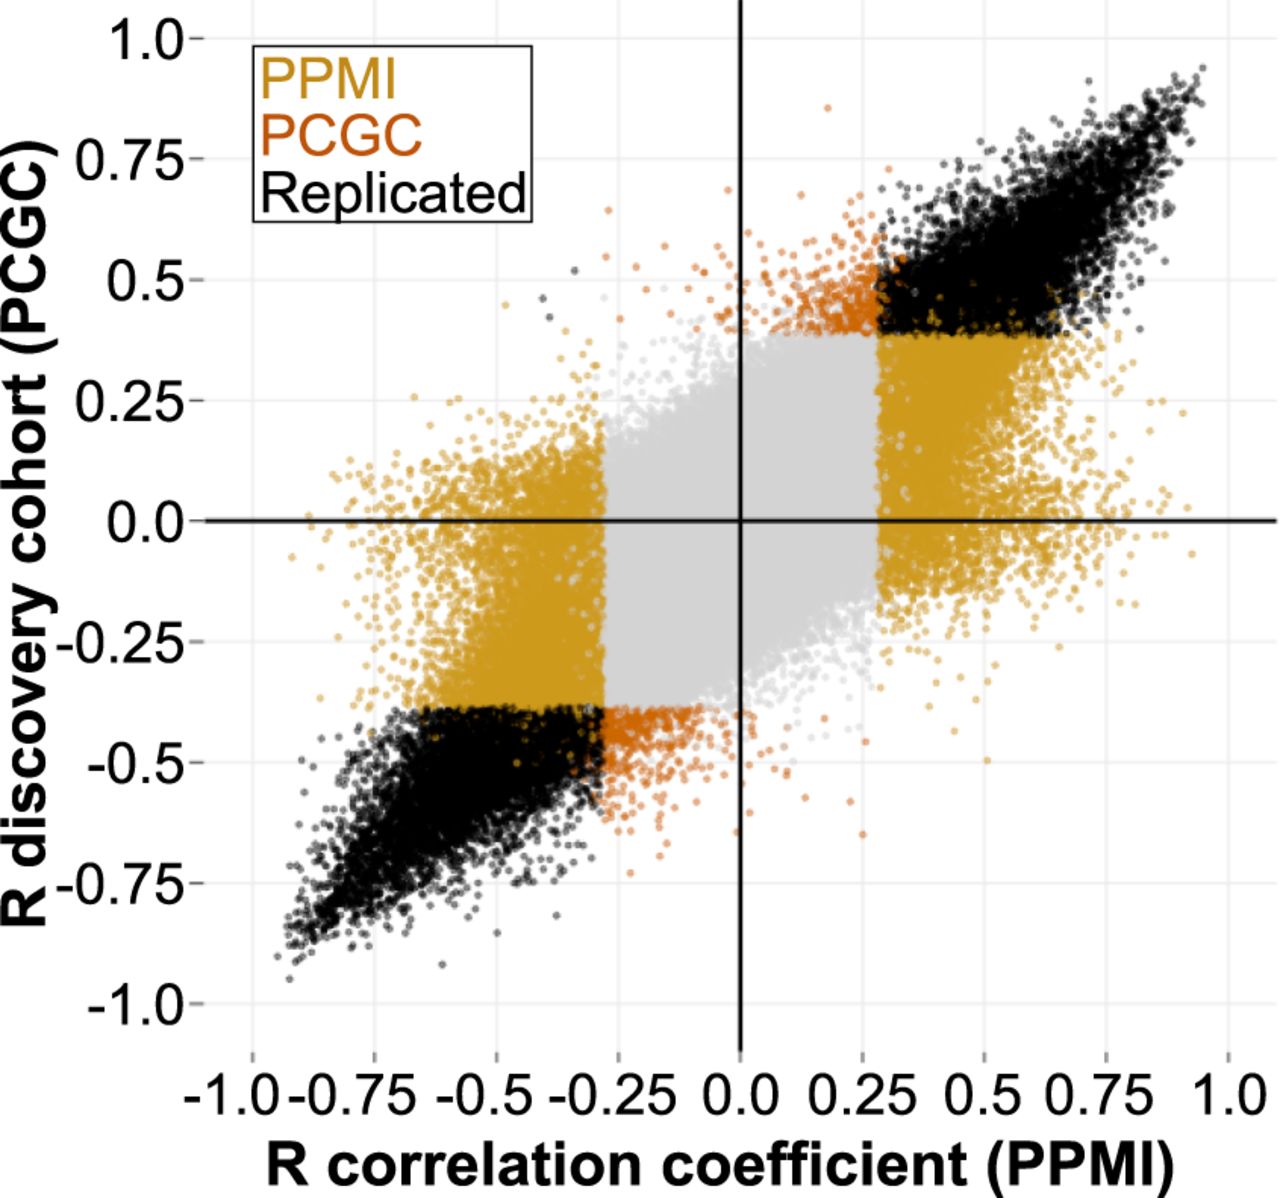
Replication of STR:CpG associations. Scatter plot showing the comparison between the correlation coefficient (r) obtained from the association analysis in our discovery (PCGC, n = 245; y-axis) and replication cohort (PPMI, n = 484; x-axis). Each dot represents a single association test (STR:CpG). Dots are color-coded according to their significance (Bonferroni-adjusted P < 0.001). Light gray dots represent nonsignificant STR:CpG associations identified in our discovery and replication analysis; black dots represent significant associations present in both cohorts. Light and dark orange dots represent significant associations observed solely in either our replication or discovery cohort, respectively.


