
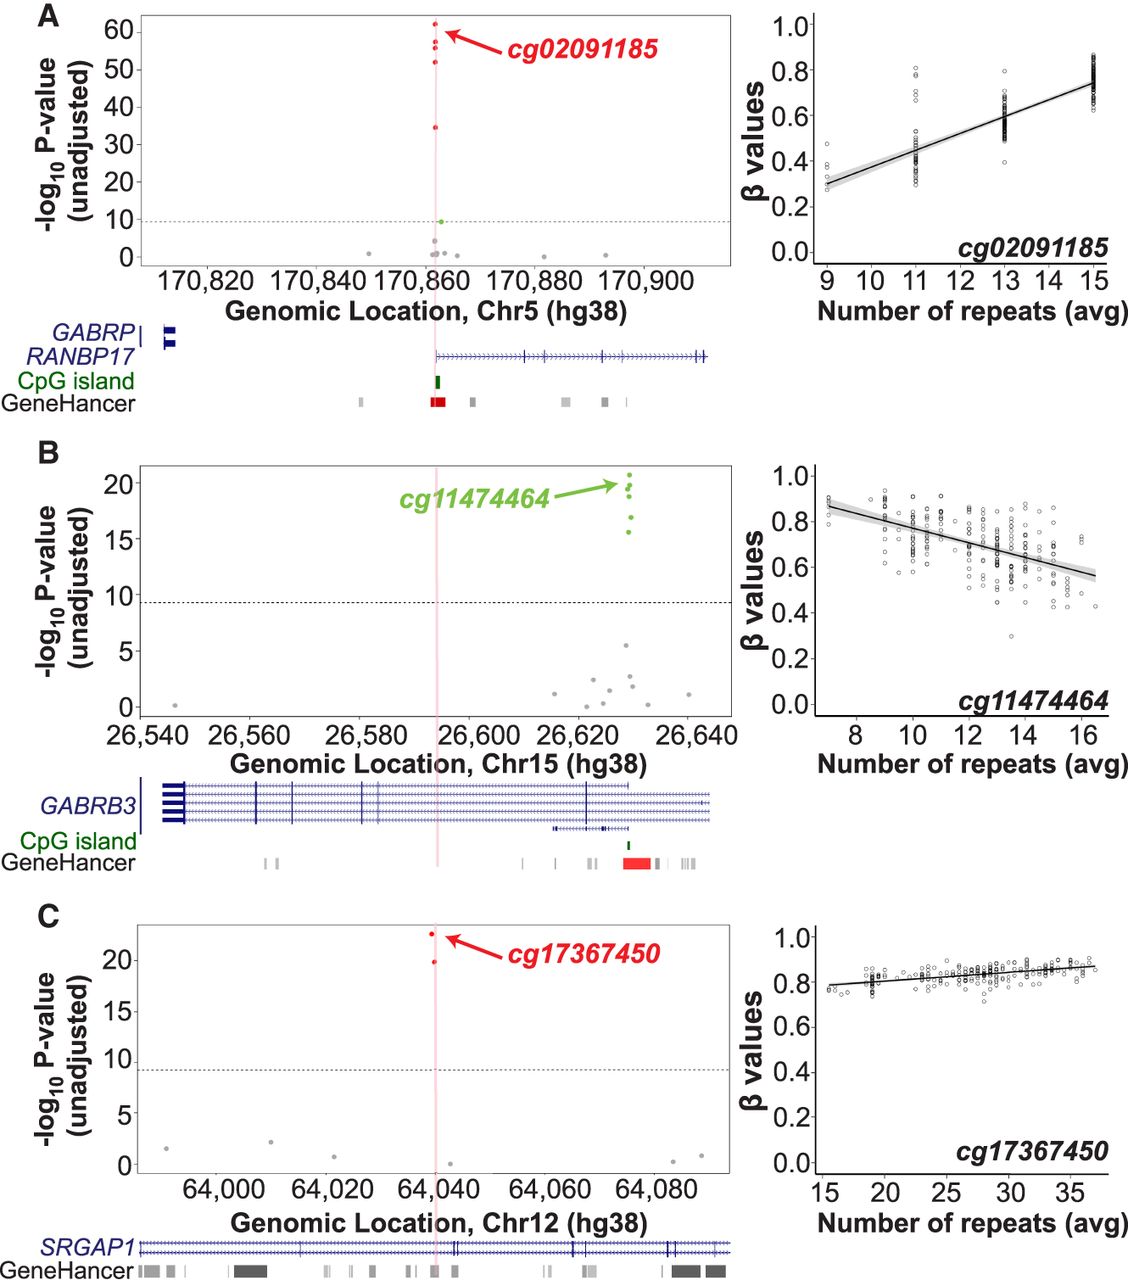
Examples of cis associations between STR length and local CpG methylation levels. Each Manhattan plot shows the association signals with CpG methylation ±50 kb of a genotyped STR: (A) Chr 5: 170,861,820–170,861,870, (B) Chr 15: 26,593,982–26,594,004, and (C) Chr 12: 64,039,629–64,039,660. Each circle represents a CpG, with significant associations shown either in red (positive correlations) or green (negative correlations). Panels A and B show a consistent positive and negative correlation between the STR length and β-values of multiple CpGs that map in the promoter region of RANBP17 and GABRB3, respectively. Panel C shows a consistent positive correlation between the STR length and β-values of two CpGs located at an enhancer. The location of the STR is shown by the vertical red line. The horizontal gray dashed line indicates the genome-wide significance threshold (Bonferroni-adjusted P < 0.001). Manhattan plots are annotated with genes (blue), CpG islands (green), enhancers (gray bars), and promoters (red bars) using NCBI RefSeq, cpgIslandExt, and GeneHancer tracks from the UCSC Genome Browser, respectively. In each case, the right panel shows a scatter plot of the average diploid STR genotypes (x-axis) and methylation β-values (y-axis) of the strongest associated (by P-value).


