
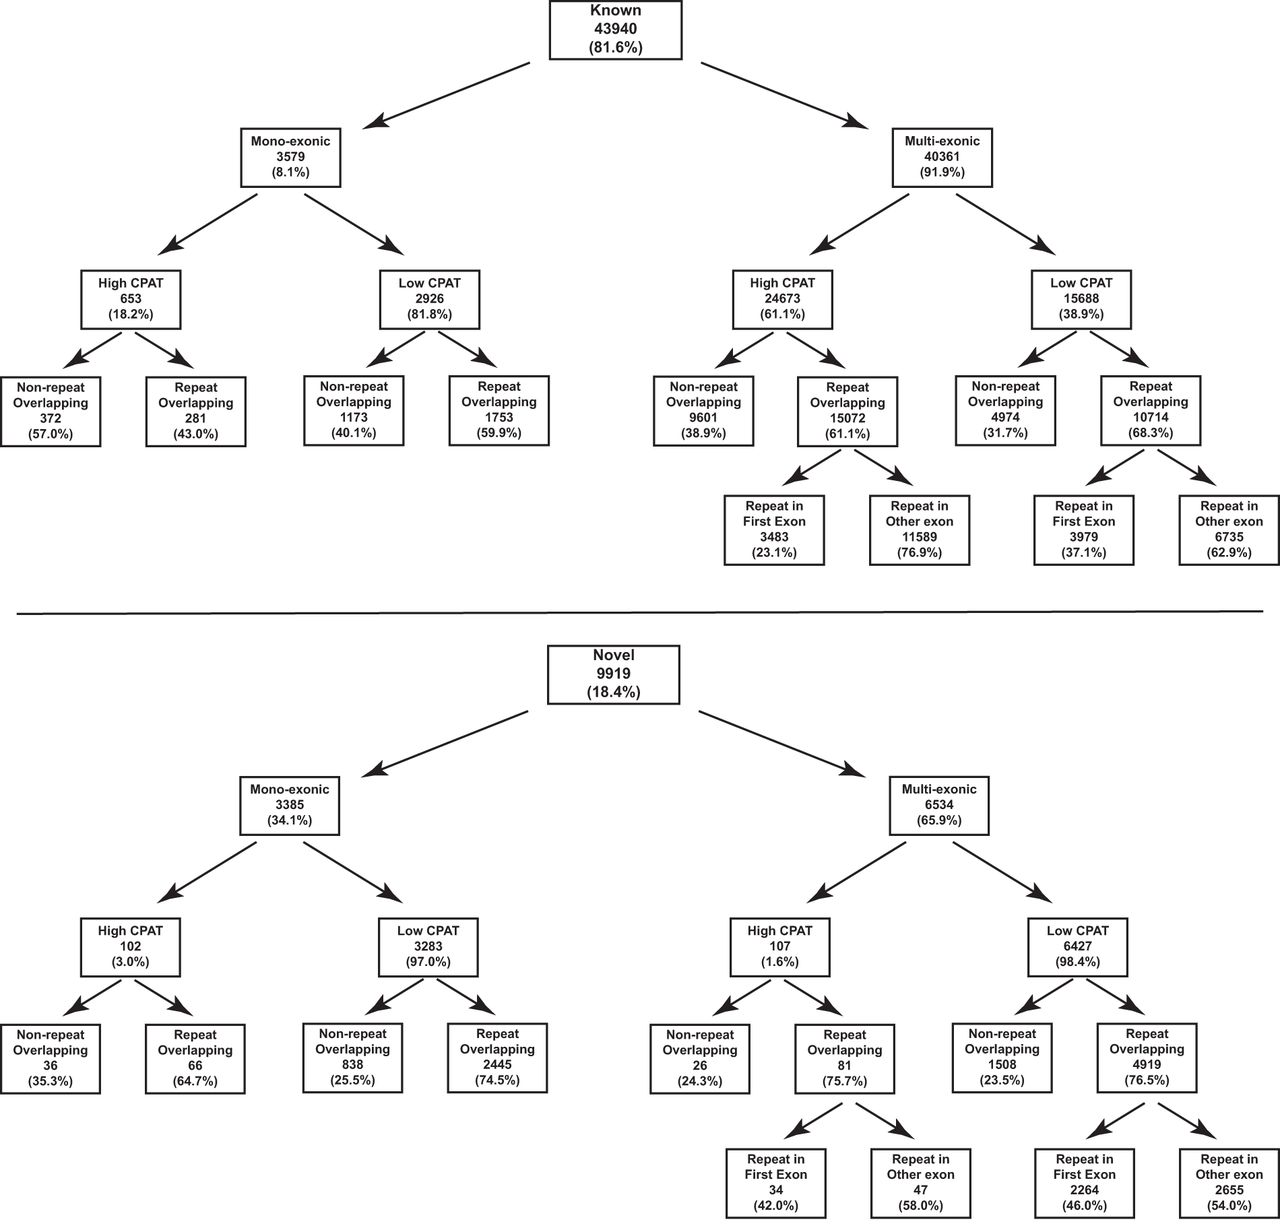
Figure 7.
Summary of genes identified as expressed in postreplicative spermatogenic cells. Flow chart showing number of genes in each category: known versus novel, monoexonic versus multiexonic, high versus low coding potential, and repeat-overlapping versus nonoverlapping. The percentage in each box refers to percentage of the parent category.


