
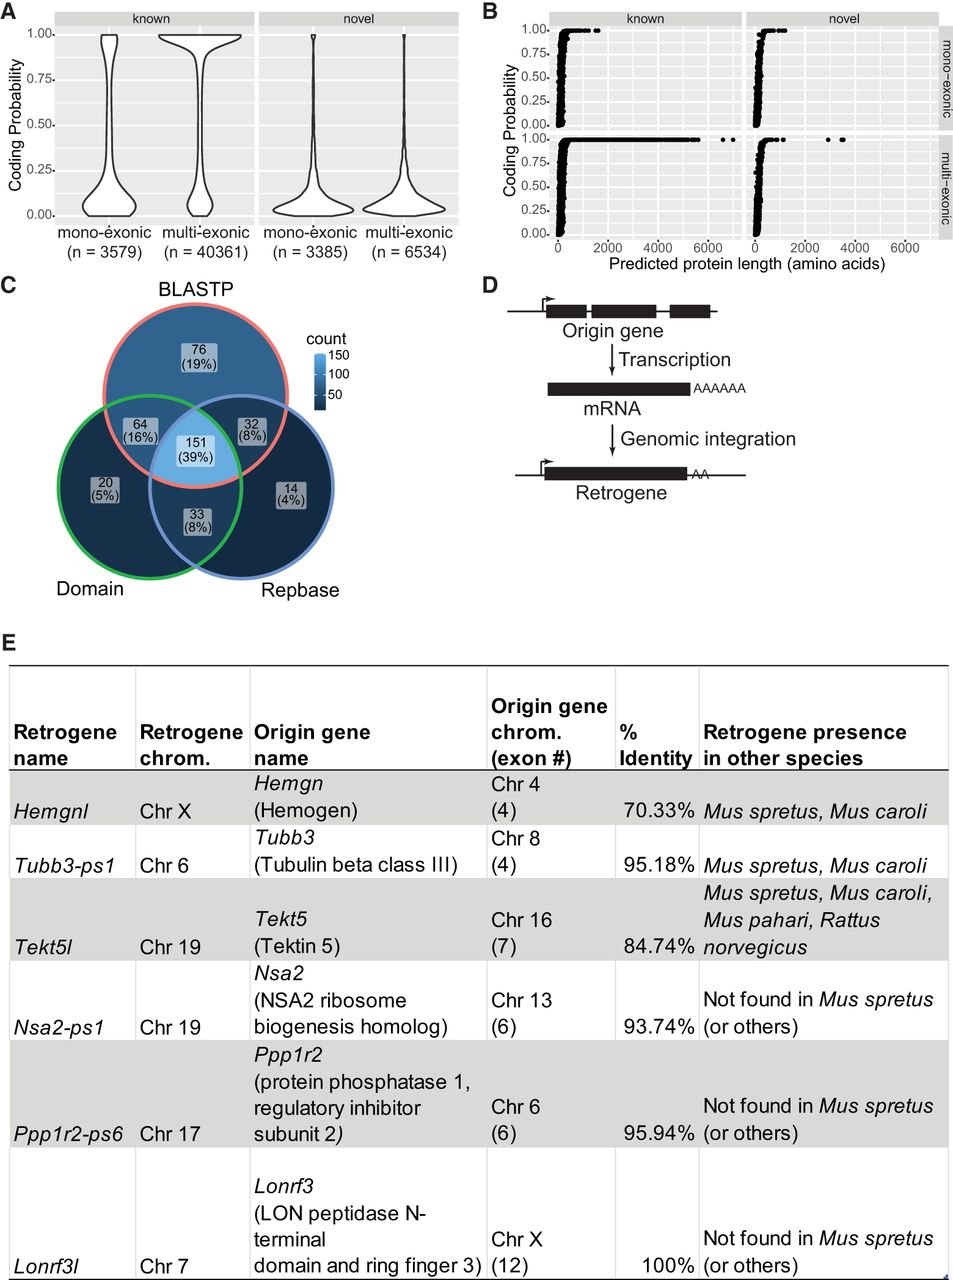
Coding potential of newly identified genes. (A) Violin plots showing CPAT-calculated coding probability for genes subdivided by overlap with GENCODE and number of exons (n indicates the number of genes in each class). (B) Plots showing predicted protein length versus CPAT-calculated coding probability for genes subdivided as in A. (C) Venn diagram showing fraction of ORFs overlapping with three databases: BLASTP, nonredundant BLASTP database; domain, conserved domain database; and Repbase, Repbase repeat elements. (D) Schematic cartoon of retrogene generation. (E) Table showing details for six identified retrogenes. The % identity refers to similarity between origin gene and retrogene in Mus musculus.


