
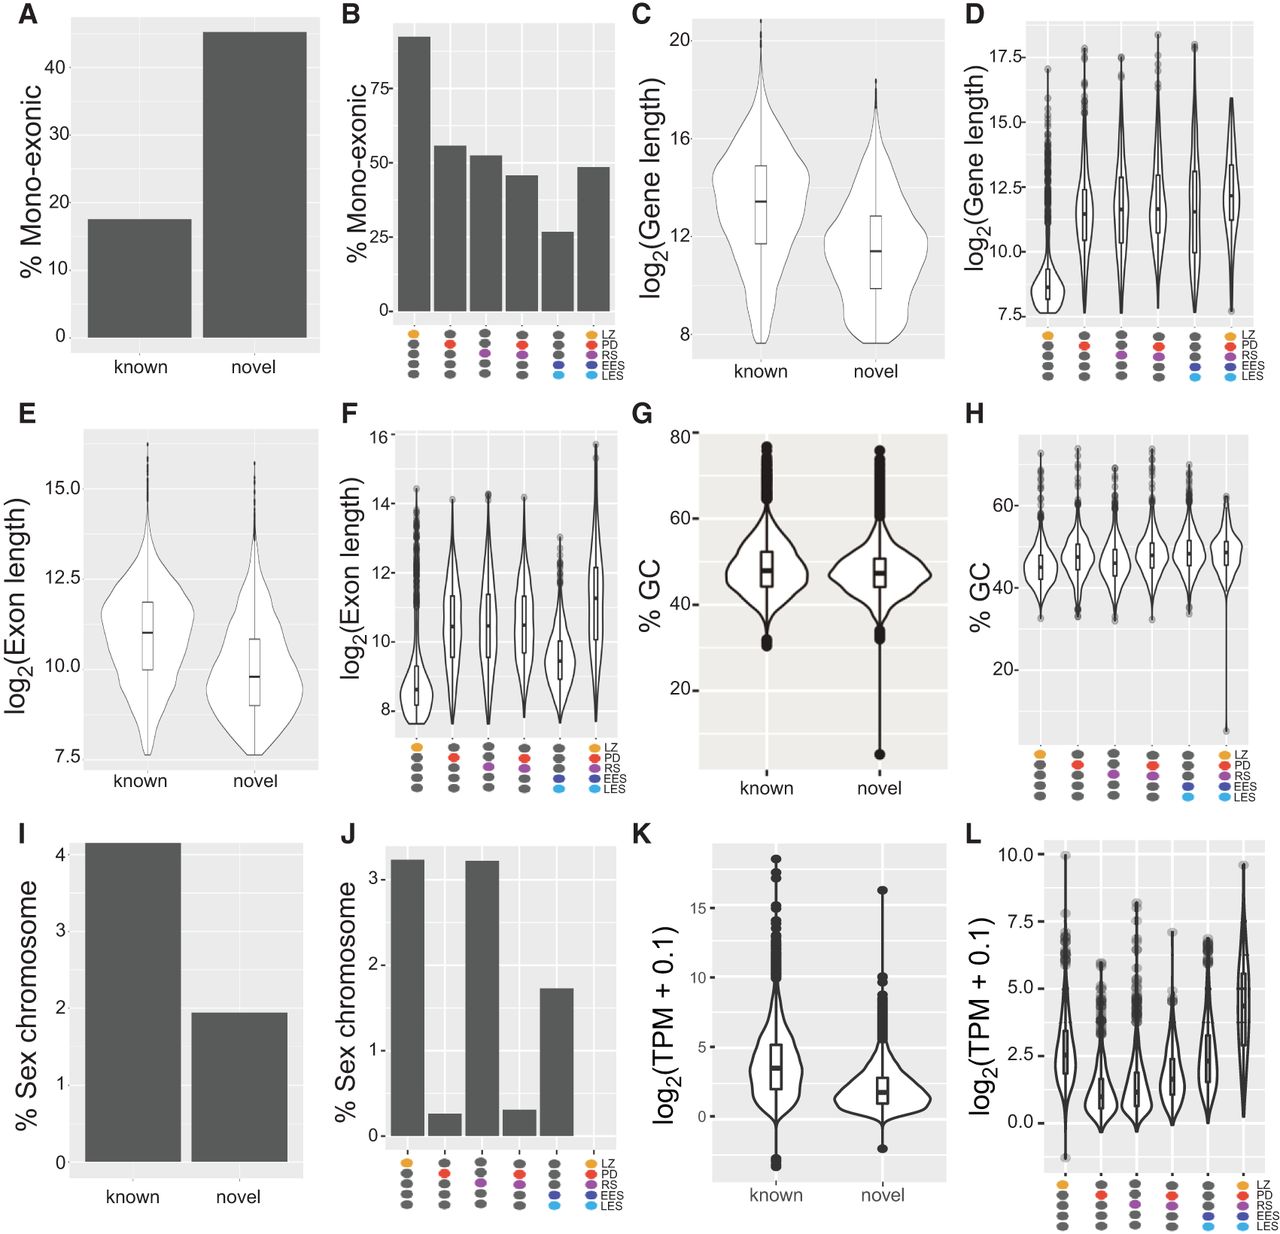
Characteristics of newly annotated spermatogenesis-expressed genes. (A,C,E,G,I,K) Comparisons between all novel to known genes. (B,D,F,H,J,L) Comparisons between classes of novel genes with different developmental expression patterns (indicated by colored ovals under the x-axes). (A,B) Bar plots showing percentage of identified genes containing only a single exon. (C–F) Violin plots showing distributions of log2 of gene length (C,D, including introns) or exon length (E,F). (G,H) Violin plots comparing distributions of GC% between different gene categories. (I,J) Bar plots showing fraction of genes mapping to the X or Y Chromosomes. (K,L) Violin plots comparing log2(transcripts per million[TPM] + 0.1) between different gene categories.


