
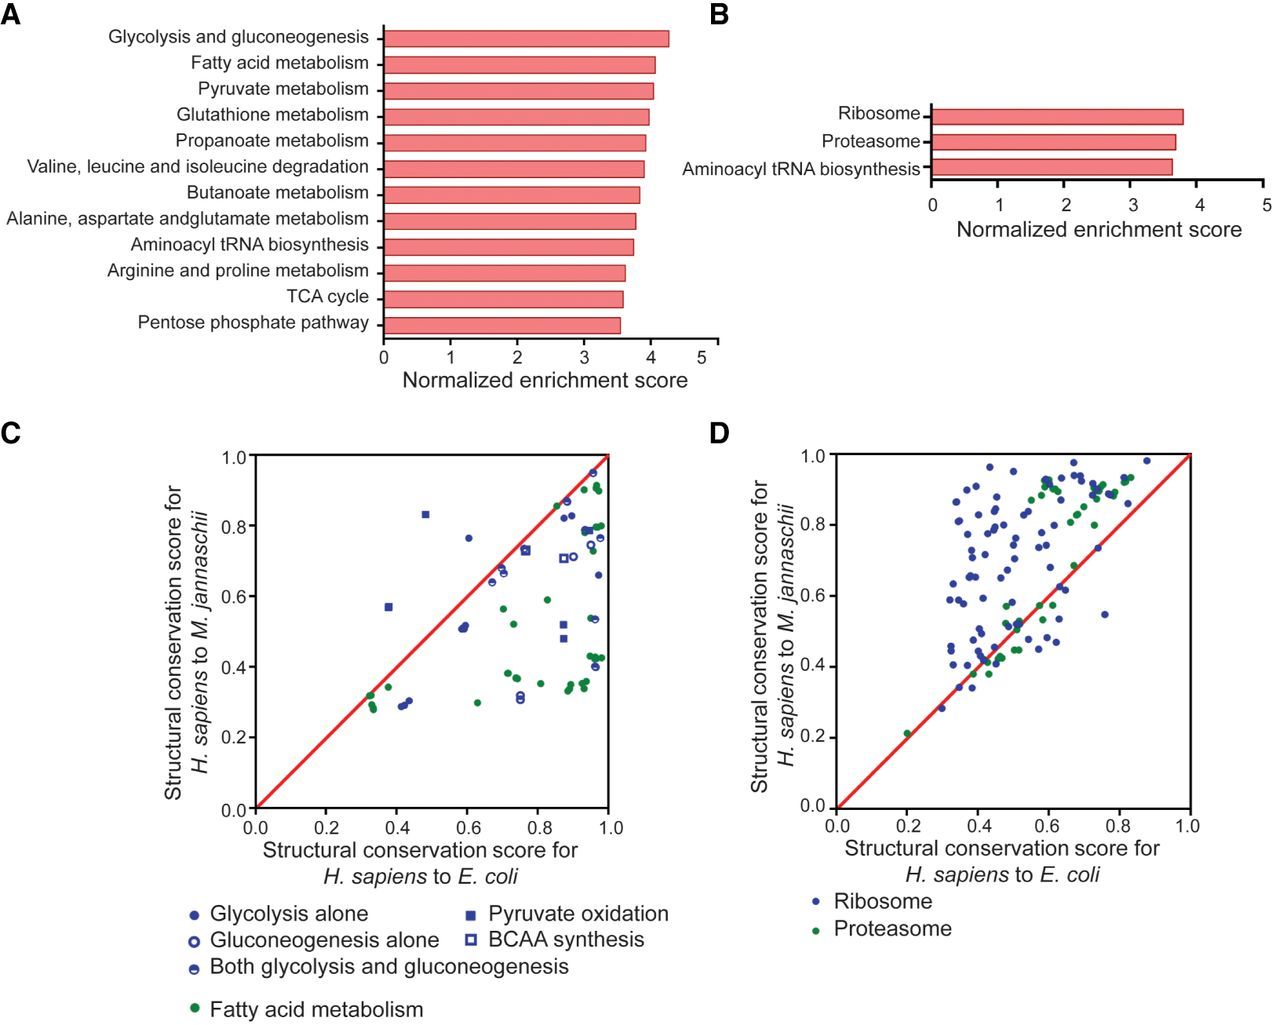
Global comparison of the structures between distantly related species indicates that structurally conserved genes are enriched in specific pathways. (A,B) Gene set enrichment analysis for all protein-coding genes in the human genome with structural conservation scores for H. sapiens to E. coli (A) and H. sapiens to M. jannaschii (B) used as ranking metrics. The built-in KEGG pathway gene sets were used to evaluate the enriched gene set. The bar charts show significantly enriched gene sets with normalized enrichment scores over 3.5. The enrichment analysis reveals the likelihood of the genes in the indicated gene set being ranked at the top of the ranked list based on structural similarity. (C,D) Comparison of the structural conservation scores for H. sapiens to E. coli and H. sapiens to M. jannaschii of protein-coding genes in selected gene sets. Points above the diagonal indicate that the conservation score on the y-axis is better than that on the x-axis. Part C corresponds to the gene sets enriched in the conserved genes for H. sapiens to E. coli. Part D corresponds to gene sets enriched in the conserved genes for H. sapiens to M. jannaschii. For the lists of genes in the gene sets, see Supplemental Table S5.


