
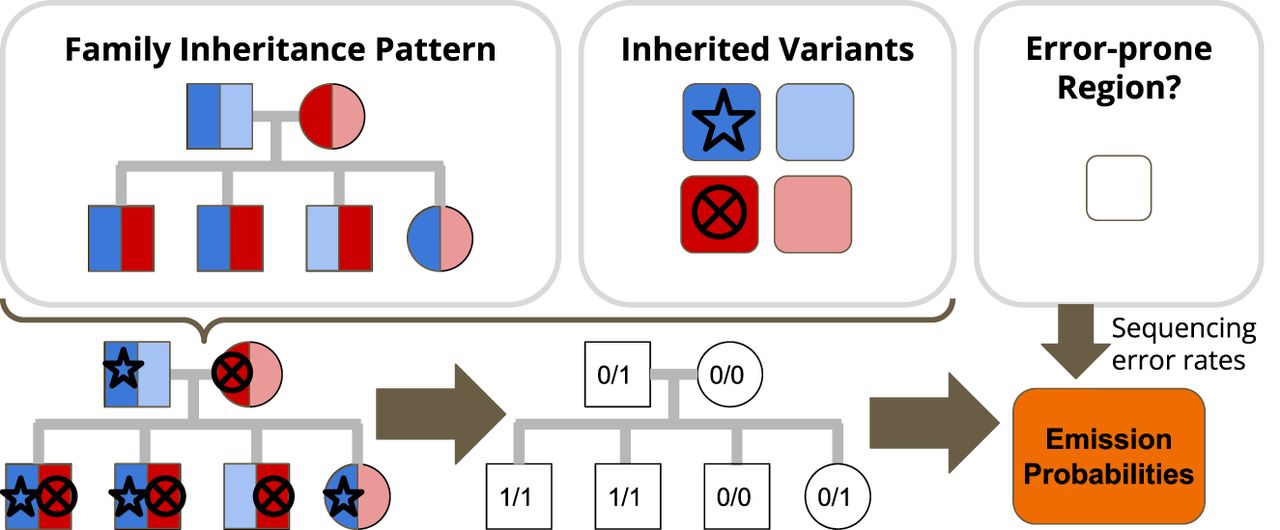
Figure 9.
HMM emission probabilities. Emission probabilities represent the probability of observing a set of family variant calls given that we are in a particular state. To estimate these probabilities, we first use the family inheritance pattern and the inherited variants to calculate the expected genotypes for the family. We then use the error-prone region flag to determine which set of variant calling error rates to use for the state. Finally, we calculate the emission probabilities for the state.


