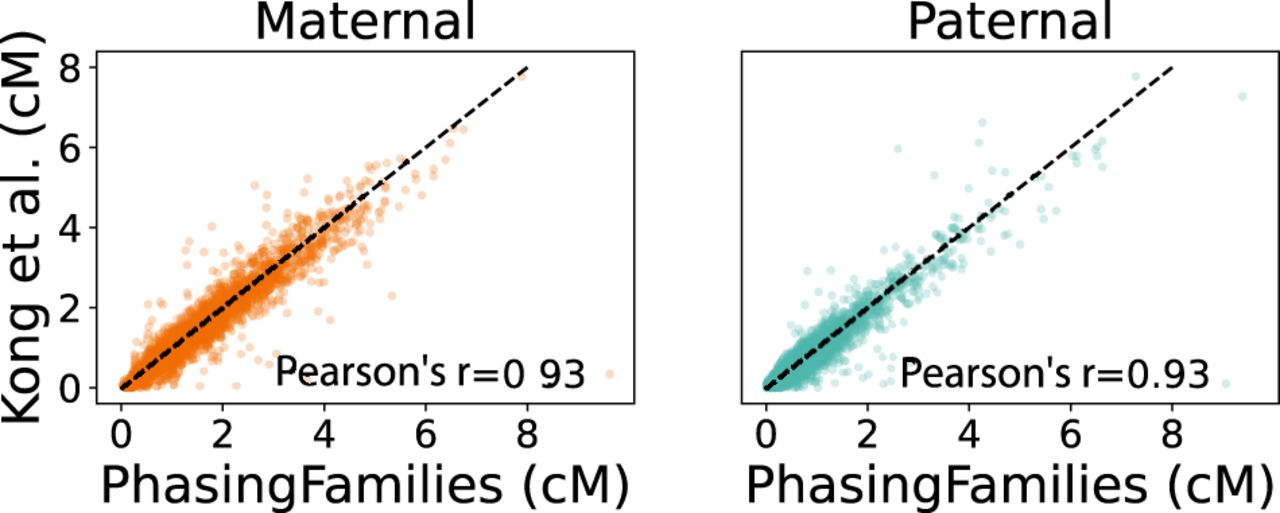
Identifying crossovers and shared genetic material in whole genome sequencing data from families

(Downloading may take up to 30 seconds. If the slide opens in your browser, select File -> Save As to save it.)

Click on image to view larger version.

Figure 4.
Figure 4.

Comparison of recombination rates. We used our crossovers to produce recombination rate maps for 1-Mbp bins across the genome. PhasingFamilies produced recombination rates that correlate well with previously published (Kong et al. 2010) recombination maps.

This Article

  1. Genome Res. 33: 1747-1756

Preprint Server