
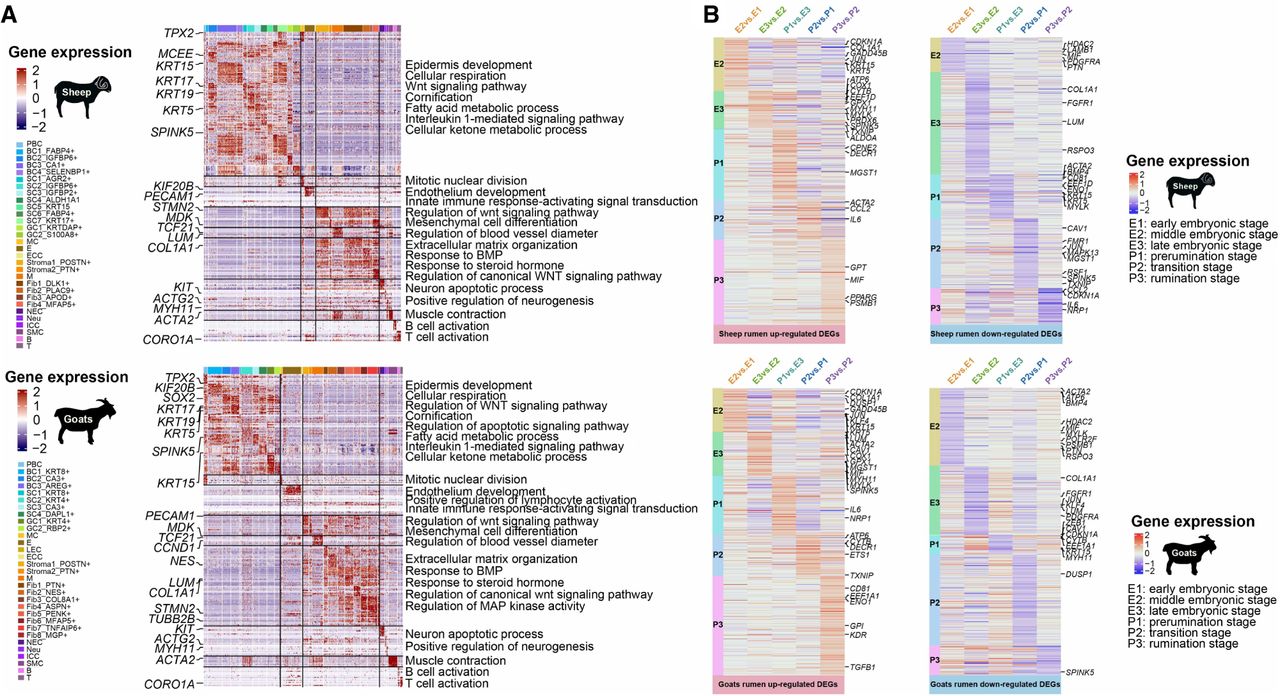
Figure 3.
scRNA-seq-based gene expression in rumen cell atlases of sheep and goats. (A) Heatmap showing the top 10 expressed genes (row) in each cell (column) in sheep and goat rumen. The right panel shows the significant (Padj < 0.05) Gene Ontology (GO) terms for the marker genes in each cell type. (B) Heatmaps showing the up-regulated and down-regulated DEGs for each pairwise comparison between different stages (stages E2 vs. E1, E3 vs. E2, P1 vs. E3, P2 vs. P1, and P3 vs. P2) in sheep and goat rumen. The abbreviations of the cell names are shown in Figure 1.


