
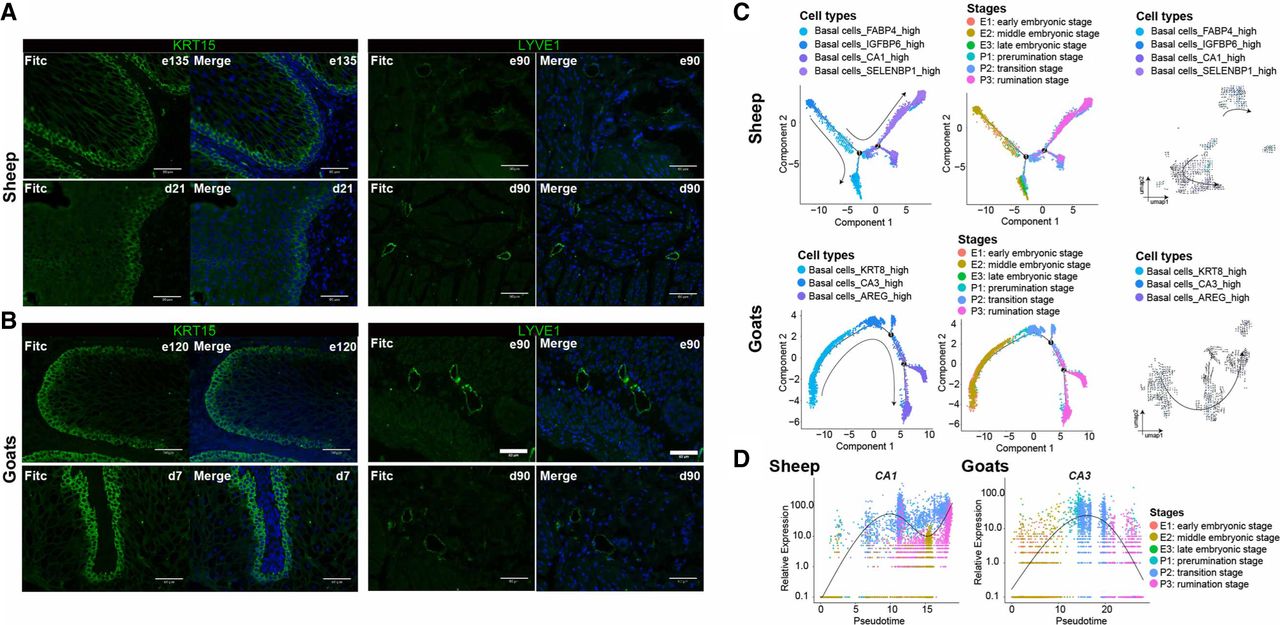
Immunofluorescence staining and pseudotime trajectory analysis. (A) Immunofluorescence of KRT15 in rumen tissues of sheep at the time points e135 and d21 and of goats at the time points e120 and d7. Scale bars, 60 μm (zoomed-in image). (B) Immunofluorescence of LYVE1 in rumen tissues of sheep and goats at the time points e90 and d90. Scale bars, 60 μm (zoomed-in image). (C) Pseudotime trajectory analysis corresponding to the differentiation of basal cells in sheep and goats. Cells are colored by pseudotime, cell types, and sample stages. (D) Pseudotime trajectory analysis corresponding to the marker gene CA1 in sheep and CA3 in goats. Cells are colored by sample stage.


