
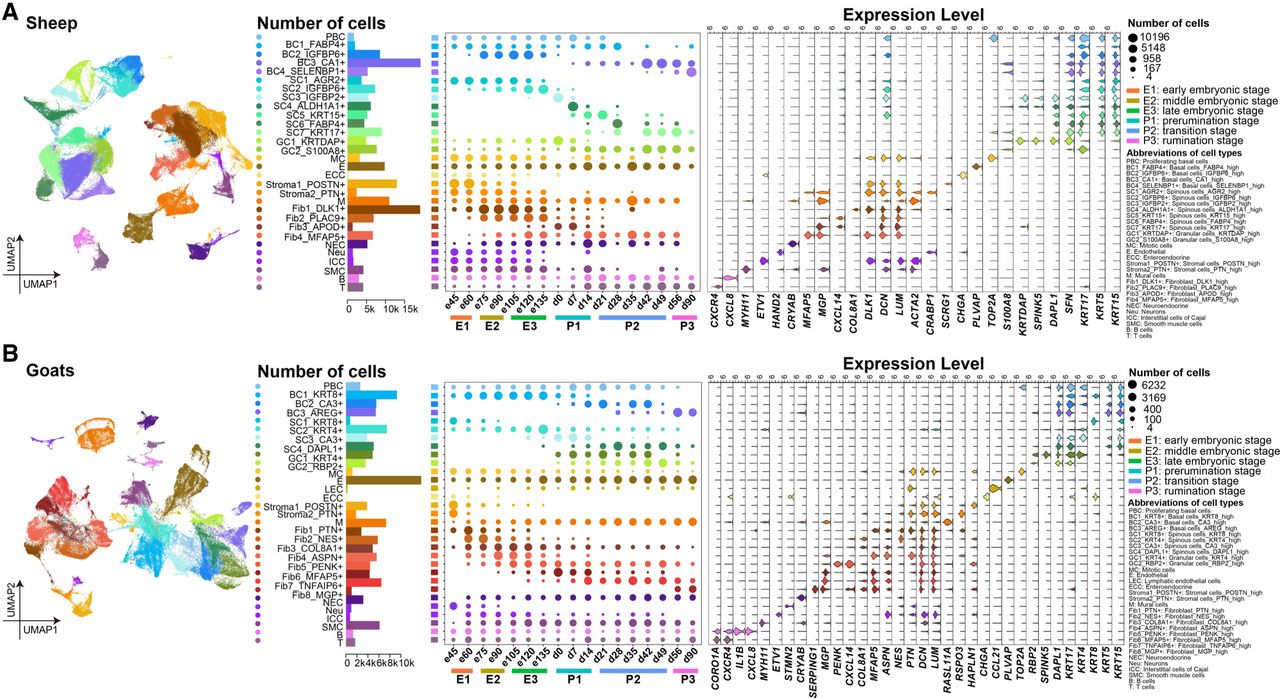
Figure 1.
UMAP plots and the number of cell types. Cell number (n > 3) at the 17 time points (middle) and expression levels of representative marker genes shown as violin plots (right) for each cell type in sheep (A) and goat (B) rumen.


