
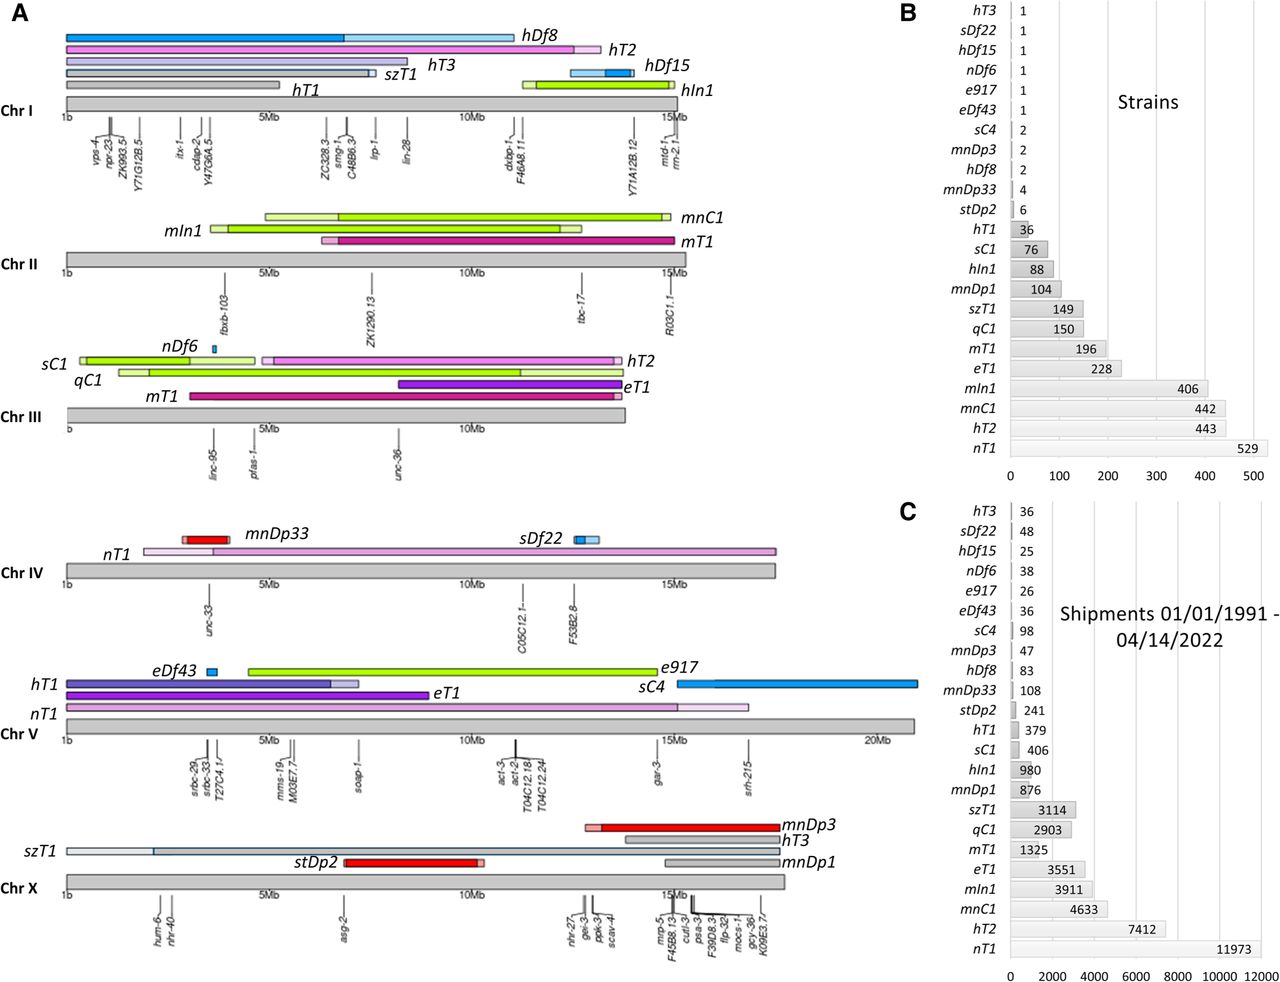
Overview of balancers. (A) Map of the C. elegans genomic regions balanced by rearrangements previously characterized at molecular level by our group (Edgley et al. 2021; Flibotte et al. 2021; Maroilley et al. 2021) or included in this study. Blue bars are for deletions. Green bars are for inversions or complex inversions. Purple and pink bars are for rearrangements involving translocations without large variation in copy number. Red bars are for rearrangements with copy number gains. Gray bars are for balancers not retrieved in this study, probably owing to breakage of balancers, or for which data are supporting the presence of a derivative. Darker colors represent the region covered by each balancer as described in previous studies. Lighter colors are the additional regions found balanced in this study. (B) Chart representing the number of strains available at the CGC carrying each balancer. (C) Chart representing the number of shipments between 1991 and 2022 of strains containing each balancer.


