
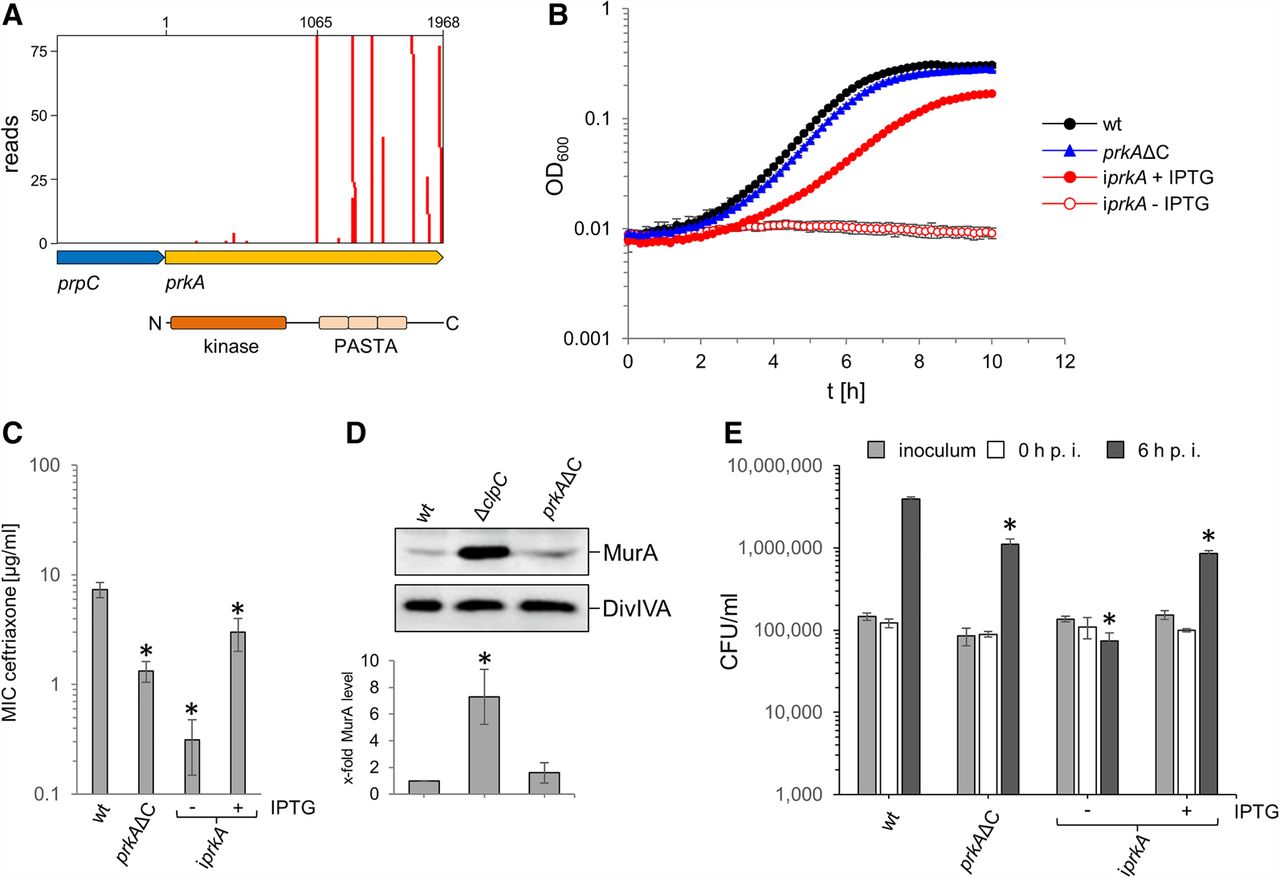
Dispensability of the prkA PASTA domains for L. monocytogenes viability. (A) Tn insertions at the prkA locus. Numbers refer to nucleotides in the prkA gene. The arrangement of PrkA domains is given below. (B) Viability of an L. monocytogenes prkAΔC mutant. L. monocytogenes strains EGD-e (wt), LMSW84 (iprkA), and LMS278 (prkAΔC) were grown in BHI broth (containing IPTG where indicated) at 37°C. Average values and standard deviations calculated from technical replicates (n = 3) are shown. (C) Increased cephalosporin sensitivity of an L. monocytogenes prkAΔC mutant. Susceptibility of the same set of strains as in B against ceftriaxone was determined using E-tests. Average values and standard deviations were calculated from three independent repetitions. Asterisks mark statistically significant differences (P < 0.01, t-test with Bonferroni–Holm correction). (D) MurA level in an L. monocytogenes prkAΔC mutant. Western blots showing signals specific for MurA (top) in L. monocytogenes strains EGD-e (wt), LMJR138 (ΔclpC), and LMS278 (prkAΔC). A parallel western blotting showing DivIVA-specific signals was included for a control (middle). MurA signals were quantified by densitometry, and average values and standard deviations calculated from three independent repetitions are shown (bottom). The asterisk indicates significance level (P < 0.05, t-test with Bonferroni–Holm correction, n = 3). (E) Reduced intracellular multiplication of the prkAΔC mutant. The same set of strains as above was used to infect J774 mouse macrophages, and bacterial cell numbers were determined right after (0 h post infection [p.i.]) and 6 h p.i. The experiment was performed as a triplicate from which average values and standard deviations were calculated. Statistical significance is indicated by asterisks (P < 0.001, t-test with Bonferroni–Holm correction).


