
Abstract
Understanding how regulatory mechanisms evolve is critical for understanding the processes that give rise to novel phenotypes. Snake venom systems represent a valuable and tractable model for testing hypotheses related to the evolution of novel regulatory networks, yet the regulatory mechanisms underlying venom production remain poorly understood. Here, we use functional genomics approaches to investigate venom regulatory architecture in the prairie rattlesnake and identify cis-regulatory sequences (enhancers and promoters), trans-regulatory transcription factors, and integrated signaling cascades involved in the regulation of snake venom genes. We find evidence that two conserved vertebrate pathways, the extracellular signal-regulated kinase and unfolded protein response pathways, were co-opted to regulate snake venom. In one large venom gene family (snake venom serine proteases), this co-option was likely facilitated by the activity of transposable elements. Patterns of snake venom gene enhancer conservation, in some cases spanning 50 million yr of lineage divergence, highlight early origins and subsequent lineage-specific adaptations that have accompanied the evolution of venom regulatory architecture. We also identify features of chromatin structure involved in venom regulation, including topologically associated domains and CTCF loops that underscore the potential importance of novel chromatin structure to coevolve when duplicated genes evolve new regulatory control. Our findings provide a model for understanding how novel regulatory systems may evolve through a combination of genomic processes, including tandem duplication of genes and regulatory sequences, cis-regulatory sequence seeding by transposable elements, and diverse transcriptional regulatory proteins controlled by a co-opted regulatory cascade.
The evolution of novel traits necessitates the evolution of novel gene regulatory architecture, which may involve the evolution of novel regulatory features, co-option or “rewiring” of existing networks and trans-activating regulatory molecules, or a combination of both (Babu et al. 2004; Teichmann and Babu 2004; Wagner and Lynch 2010). Understanding the processes by which novel regulatory systems evolve to drive novel functions can provide valuable insight into the fundamental question of how novel regulatory architectures arise, and provide new perspectives on the processes and constraints that govern adaptation. However, understanding the features that coordinate gene regulation is particularly challenging in eukaryotes because it involves the simultaneous action of cis- and trans-regulatory factors, chromatin state, and three-dimensional interactions of chromatin, including the precise coordination of enhancers and promoters (Cremer and Cremer 2001; Ragoczy et al. 2003; Misteli 2007; Delaneau et al. 2019).
Snake venom systems provide an ideal system to understand how novel regulatory systems evolve and function owing to the tractable size of gene families that comprise venom, as well as the direct relationships between venom gene (VG) expression, phenotype, and fitness (Casewell et al. 2012; Rokyta et al. 2015; Holding et al. 2016; Zancolli and Casewell 2020). At the core of these venom systems is a highly specialized secretory organ: the snake venom gland (Kochva et al. 1980; Mackessy 1991; Mackessy and Baxter 2006). Within the venom gland, multiple VG families contribute proteins to venom (Mackessy 2021). Some VG families are arranged in tandemly arrayed gene clusters, and most VGs are thought to have evolved through tandem duplication of genes with other physiological functions, followed by neo- or subfunctionalization to venom-specific roles and expression in the venom gland (Fry et al. 2008; Casewell et al. 2013; Vonk et al. 2013; Hargreaves et al. 2014b). Despite an extensive body of literature on snake venom systems, the mechanistic underpinning of the regulation of snake VGs and the evolutionary origins of their regulatory architecture remain poorly understood. To date, a small number of studies have identified several transcription factors (TFs) and signaling pathways that may play a regulatory role in at least some species and some VG families, although no studies have identified the scope of the regulatory system that broadly regulates snake venom expression, or the evolutionary origins of this regulatory system (Yamanouye et al. 2000; Kerchove et al. 2004, 2008; Hargreaves et al. 2014b; Junqueira-de-Azevedo et al. 2015; Zancolli and Casewell 2020; Margres et al. 2021). These studies identified a set of TFs, including AP-1, NF-kB, and FOX-, NF1-, and GRHL-family members, for which identifiable binding sites occur in the promoters of various VGs (Luna et al. 2009; Nakamura et al. 2014; Schield et al. 2019; Margres et al. 2021). Other studies have implicated the high-level regulatory involvement of alpha- and beta-adrenergic receptors and signaling through the ERK/MAPK pathway in initiating the venom production cascade (Yamanouye et al. 2000; Kerchove et al. 2008); however, subsequent studies have performed little to investigate putative venom TFs in light of higher-level regulatory networks. Recently, a study characterized regulatory pathways activated during venom production in the prairie rattlesnake and found evidence for high activation of stress response pathways, including the unfolded protein response (UPR) (Perry et al. 2020). It remains an open question, however, whether stress response mechanisms may also play some role in in the regulation of VGs. Although these prior studies provide suggestions regarding regulatory mechanisms that may be involved in venom systems, the precise details of venom regulation, its constitutive components, and the degree to which distinct VGs are regulated by common mechanisms remain unknown. Additionally, the roles of chromatin structure and enhancer–promoter architecture in regulating snake venom systems, as well as the evolutionary origins of these features, have remained largely unexplored.
Here, we leverage inferences from diverse functional genomics data to investigate the architecture and evolution of rattlesnake venom regulatory systems. Using integrated analyses of RNA sequencing (RNA-seq), assay for transposase-accessible chromatin using sequencing (ATAC-seq), chromatin immunoprecipitation sequencing (ChIP-seq) for insulators (CTCF), open promoters (H3K4me3), open enhancers (H3K27ac), and Hi-C chromatin contact data, we investigate novel regulatory regions underlying VG expression and use these inferences to address broad questions about the mechanistic architecture of snake venom regulatory systems, as well as the evolutionary origins of this architecture.
Results
VGs are highly expressed in the snake venom gland
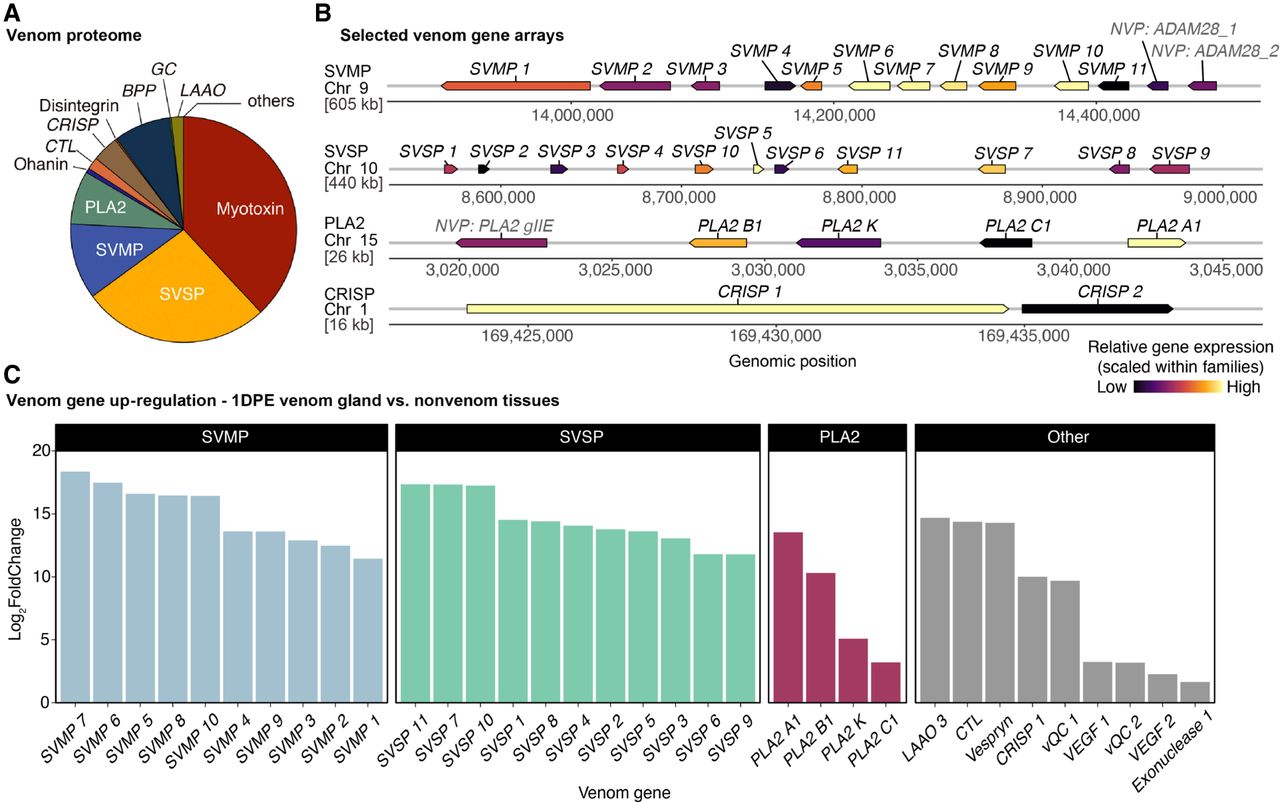
The venom proteome of the prairie rattlesnake is dominated by snake venom serine proteases (SVSPs), snake venom metalloproteinases (SVMPs), phospholipase A2 (PLA2), and peptide myotoxins (Fig. 1A), which derive from tandemly arrayed multicopy gene families (Fig. 1B; Saviola et al. 2015; Schield et al. 2019). The myotoxin cluster is not assembled in the prairie rattlesnake genome and was excluded from this study. A smaller fraction of the prairie rattlesnake venom proteome is composed of additional proteins and peptides encoded by genes in small tandem arrays (i.e., two genes) (Fig. 1B, “CRISPs”) or as individual genes (Saviola et al. 2015). For analyses, we grouped VGs by SVMP, SVSP, and PLA2 families and a category of “other” VGs that comprise the minor fraction of the venom proteome (Fig. 1C). Within the major VG families, most paralogs are highly expressed in the venom gland compared with nonvenom gland tissues (Fig. 1C). Other paralogs do not show venom gland–specific expression (i.e., SVMP 11) and likely do not contribute to secreted venom. Of the “other” VGs, nine were significantly up-regulated in the venom gland compared with nonvenom tissues (Fig. 1C, “other”); “other” VGs not significantly up-regulated in the venom gland are excluded from subsequent analyses.
Venom gene (VG) expression and structure in the prairie rattlesnake. (A) Proportions of venom protein components in prairie rattlesnake venom (adapted from Schield et al. 2019). (B) Structure of tandemly duplicated VG families, with genes colored by relative gene expression at 1DPE. Relative expression is scaled separately per family to accentuate expression variation within families. (C) VGs with significant up-regulation in the 1DPE venom gland (DESeq2 log2foldChange > 0 and IHW-corrected P-value < 0.05) compared with expression in all nonvenom tissues (stomach, pancreas, and liver).
Candidate TFs associated with venom regulation
Because many TF binding-site (TFBS) motifs are short sequences, naive searches of known TFBSs across large stretches of genomic sequences are likely to identify many putative TFBS motif sequences that are not functionally relevant or bound by the associated TF. To focus on TFs and TFBSs with evidence of a functional role in the venom gland and potentially in VG regulation, we identified a set of candidate TFs using two independent approaches (Fig. 2A; Supplemental Figs. S1, S2; Supplemental Table S2). First, we identified known TFs with elevated expression in the venom gland compared with nonvenom tissues, resulting in 111 candidate TFs (IHW-corrected P-value < 0.05 and Log2FoldChange > 1).
Candidate transcription factors (TFs) underlying VG regulation. (A) Candidate TFs involved in venom regulation, with the first three columns representing three approaches for TF identification, and the last three columns indicating TF membership in functional categories. (B) Interactions between candidate TFs and ERK (homolog of human MAPK1) based on STRINGdb. TFs with direct interactions with ERK are shown in dark blue, and TFs that interact with these are shown in light blue. Node sizes are scaled by the number of interactions with other TFs in the network. TFs also involved in the unfolded protein response (UPR) are highlighted in red.
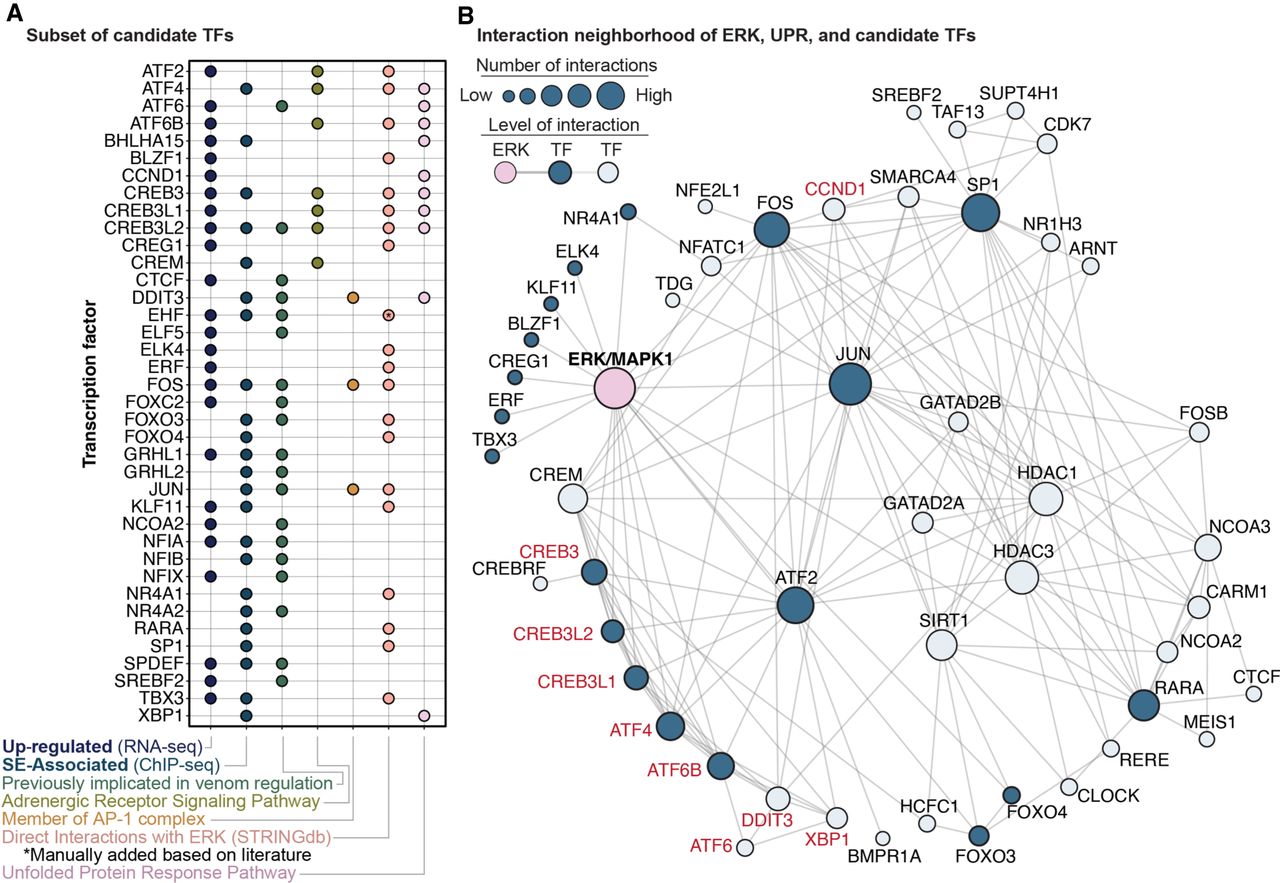
Separately, we identified super-enhancer (SE) regions throughout the genome using H3K27ac ChIP-seq data (see Methods). SEs are long regions of elevated H3K27ac histone marker signal (consistent with enhancer-associated open chromatin) that represent “hotspots” of regulatory activity and tend to occur near genes central to tissue-specific functions, including TFs (Hnisz et al. 2013; Whyte et al. 2013). SE-associated genes (genes located within or adjacent to an SE; see Methods) in the venom gland are enriched for genes coding for TFs and venom components (Supplemental Fig. S2). Of the 81 total SE-associated TFs identified, 36 are also up-regulated in the venom gland relative to nonvenom tissues (Supplemental Fig. S1). Our combined set of up-regulated and/or SE-associated TFs is composed primarily of protein-binding TFs (Supplemental Table S2), of which 72 have known TFBS motifs in the nonredundant JASPAR database (Sandelin et al. 2004).
A subset of our candidate TFs has been implicated in venom regulation in previous studies and/or is involved in broad mechanisms previously suggested to be involved in venom regulation (Fig. 2A). Several SE-associated candidate TFs are involved in adrenergic receptor binding activity, and additional candidate TFs (e.g., FOS and JUN) are components of the AP-1 TF complex (Fig. 2A; Luna et al. 2009). An additional SE-associated candidate TF (EHF) was previously suggested to play a role in regulating venom PLA2 genes in Protobothrops (Nakamura et al. 2014). Other candidate TFs have been identified as potential regulators of VGs in separate genomic studies, including FOX-family TFs, GRHL1, NFIA and NFIB, XBP1 (Fig. 2A; Margres et al. 2021; Schield et al. 2019). EHF, NFIA, GRHL1, FOS, and JUN are both up-regulated and SE-associated in the prairie rattlesnake venom gland, providing additional evidence for a role in venom regulation.
Our results also highlight evidence for the co-option of two conserved vertebrate pathways—ERK and UPR signaling—in the regulation of venom. Direct interactions with ERK were identified for 19 candidate TFs (Fig. 2A,B) based on the STRINGdb database (Szklarczyk et al. 2019), and 31 additional TFs had known interactions with these 19 TFs (i.e., second-degree interactions with ERK; Fig. 2B). This is validated by KEGG pathway analysis of the full candidate TF set indicating overrepresentation of TFs involved in the ERK/MAPK signaling pathway (enrichment ratio = 2.4937, FDR = 0.044238). Additionally, 10 candidate TFs are members of the UPR pathway, including ATF6, BHLHA15, and CREB3L2, which are both up-regulated and SE-associated in the venom gland (Fig. 2A). As illustrated by the interaction network based on the STRINGdb, many of these UPR-associated TFs also interact with ERK and ERK-associated TFs (Fig. 2B).
Promoter chromatin state and venom expression
We used H3K4me3 ChIP-seq data to investigate the relationships between gene expression and open promoters at 1DPE (Fig. 3; Supplemental Fig. S3). Genome-wide, ∼41% of promoters are inferred to be open in the postextraction venom gland, and genes with open promoters are more highly expressed (Supplemental Fig. S3A). This result is also observed for VGs when analyzed together (Supplemental Fig. S3B). Within specific VG families, SVMPs with open promoters are more highly expressed than those without (Mann–Whitney U test, P < 0.05) (Supplemental Fig. S3C), and all PLA2 gene promoters overlap with an H3K4me3 peak (Supplemental Fig. S3E). SVSPs and the combined group of “other” VGs with open promoters do not show significantly higher expression than those without open promoters (Supplemental Fig. S3D,F).
VG promoters are bound by TFs linked to ERK and UPR signaling pathways
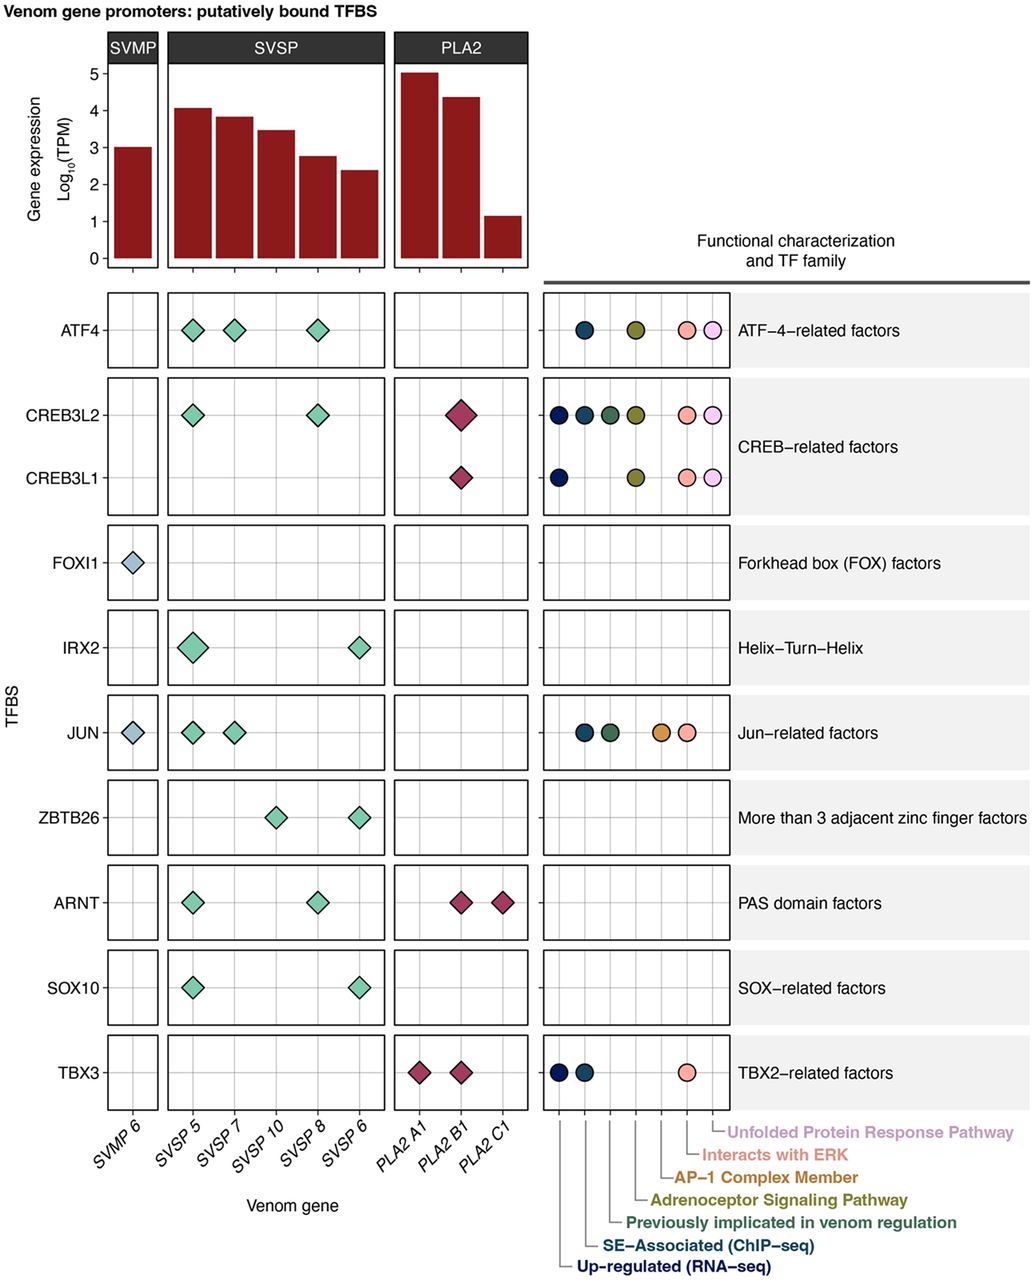
We identified TFBSs for candidate TFs with enrichment in VG promoters compared with the promoters of nonvenom genes. A total of 11, nine, and nine candidate TFBSs are significantly enriched in SVMP, SVSP, and PLA2 promoters, respectively, compared with nonvenom gene promoters (Supplemental Fig. S4; Supplemental Table S3). Several TFs are enriched in two of the three families (JUN, CREB3L2, ELK4, TFAP4, ARNT, FIGLA); none are enriched in promoters of all three (Supplemental Fig. S4). Using ATAC-seq footprinting scores calculated for each ATAC-seq sample with TOBIAS (Bentsen et al. 2020), we assessed whether specific candidate TFBSs in VG promoters showed evidence of being bound by a protein (i.e., TF) in the postextraction venom gland. A TFBS was considered “bound” if the average footprint score across the TFBS exceeded the bound threshold determined by TOBIAS BINDetect (P-value < 0.001) in at least two of the three ATAC-seq replicates. In PLA2 promoters, TBX3 is inferred to be bound in promoters of the two highly expressed paralogs, PLA2A1 and PLA2B1 (Fig. 4), but not in the lowly expressed PLA2C1 promoter. In SVMPs, only the promoter of the most highly expressed paralog (SVMP 6) contains TFBSs with consistent evidence of being bound (JUN and FOXL1; Fig. 4). The promoters of the two most highly expressed SVSPs, SVSP 5 and SVSP 7, both contain bound TFBSs for ATF4 and JUN, with SVSP 5 also containing bound TFBSs for ARNT, CREB3L2, IRX2, and SOX10 (Fig. 4).
Multiple TFs putatively binding to VG promoters are involved in, or are regulated downstream from, the ERK and UPR signaling pathways. These include TBX3, which is bound only in the two most highly expressed PLA2s, as well as CREB3L2, CREB3L1, JUN, and ATF4, which show evidence of bound TFBSs in one or more of the three families (Fig. 4). These findings implicate central roles of ERK and UPR signaling in the regulation of venom.
As may be expected given the tandemly duplicated nature of these VG arrays, promoter regions within each of the three VG families show a high degree of similarity (Supplemental Fig. S5), and similarity is generally most evident between promoters of the most highly expressed genes of each family. Inferred TFBS positions in promoter alignments are largely consistent among gene family members, suggesting that TFBSs are conserved to a degree among paralogs within VG clusters (Supplemental Fig. S5).
Only three of the “other” VGs have an ATAC-seq peak within their inferred promoter region (CTL, VEGF1, and VEGF2) (Supplemental Fig. S6). Because these genes do not inhabit multigene arrays, candidate TFBSs were identified simply by scanning for potential binding motifs rather than by tests of enrichment. All three of these “other” VGs are found to have putatively bound TFBSs for NFATC1, NFIX, MEIS1, and ELF5, with additional TFBSs inferred to be bound in one or two of these three promoters (Supplemental Fig. S6).
Analysis of potential novel TFBS motifs in regions of VG promoters with elevated ATAC-seq footprint scores identified one motif (Supplemental Table S4). This motif is only present in promoters of the SVMP genes and shows similarity to the TFBSs of JUN, which is enriched in SVMPs and inferred to be bound in the SVMP 6 promoter (Supplemental Table S4; Fig. 4).
Candidate TFBSs in promoters of nonvenom paralogs
We scanned promoter sequences for all annotated nonvenom paralogs for the presence of TFBSs implicated in their corresponding VG family (Supplemental Fig. S7; Supplemental Methods). Across the three families, two TFBSs are enriched in the promoters of both the venom and corresponding nonvenom paralogs (ATF4 and ZBTB26 in SVSP and paralogs) (Supplemental Fig. S7B). A larger number of TFBSs implicated in VG regulation are present in one or more nonvenom paralogs of a given VG family despite not being enriched, and each group of nonvenom paralogs are enriched for multiple TFBSs not implicated in regulation of related VGs (Supplemental Fig. S7A).
Roles of enhancers in regulating venom expression
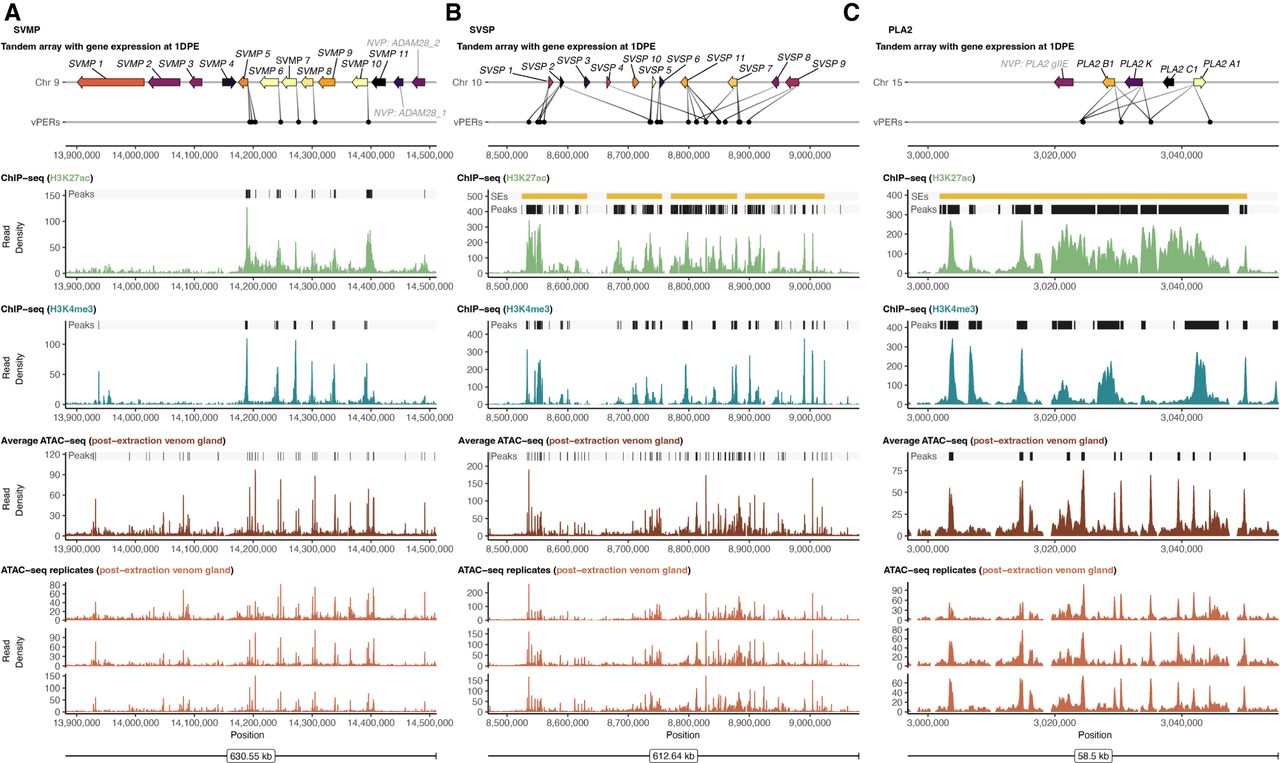
We used the activity-by-contact (ABC) model (Fulco et al. 2019) to identify putative enhancer regions (PERs) and target genes using contact information (Hi-C), chromatin accessibility (ATAC-seq), and histone modifications (H3K27ac ChIP-seq). We identified 1329 PERs across the genome associated with 837 genes in the venom gland (Supplemental Table S5), with an average of 1.87 inferred PERs per gene. PERs are most commonly located in intergenic regions (∼70% of all PERs), and the median distance between PERs and associated genes was 9331 bp. VGs are targeted by a total of 51 PERs (venom PERs [vPERs]). vPERs tend to be located relatively close to target genes with a median distance of 5614 bp. The four most highly expressed paralogs in the SVMP cluster are each associated with an individual vPER located ∼4 kb upstream of the TSS (Fig. 3A). vPERs in the SVSP cluster are more variable in terms of the number of vPERs per gene and their location relative to their target gene (Fig. 3B). All but one PLA2 vPERs are inferred to regulate multiple genes, with two vPERs inferred to regulate both highly expressed PLA2 genes (PLA2A1 and PLA2B1) (Fig. 3C). Thirteen vPERs are associated with seven “other” VGs (Supplemental Figs. S8–S14).
Functional genomic landscape of major VG clusters in the venom gland. (A–C) VG clusters with gene expression indicated by color (brighter colors are more highly expressed) and inferred interactions with putative venom enhancer regions (vPERs). For the H3K27ac ChIP-seq, H3K4me3 ChIP-seq, and ATAC-seq layers, normalized read density is shown, and peaks are highlighted by black bars at the top of each plot. Super-enhancers (SEs) are denoted by yellow bars if present. Replicated ATAC-seq data are shown at bottom.
TF binding sites (TFBSs) in VG promoter regions. TFBSs with the evidence for being bound in promoter regions of the three major VG families. Diamonds indicate TFBSs inferred to be bound in at least two out of three ATAC-seq replicates based on ATAC-seq footprinting analysis. Size of the diamond corresponds to the number of bound TFBSs inferred in a given promoter (larger = more bound sites). Log-scaled gene expression is shown above, and membership to relevant functional categories and TF families is shown on the right. Genes for which no bound TFBSs were identified in the promoter are not shown.
Patterns of enhancer TFBSs and links to ERK and UPR signaling
A greater number of TFs were found to be enriched for TFBSs in vPERs compared to promoters, with 22, 29, and four TFs enriched in SVMP, SVSP, and PLA2 vPERs, respectively (Fig. 5A; Supplemental Table S2). Two TFBSs are found to be enriched in vPERs of all three families (SOX9 and RORA), and 11 enriched TFBSs are found in both SVMP and SVSP vPERs (Fig. 5A). Based on ATAC-seq footprinting scores, putatively bound TFBSs are identified in five SVMP vPERs, including vPERs associated with three of the four most highly expressed SVMP paralogs (Fig. 5A,B). Several of these TFs, including ELF5, ARID3A, NFIX, and MEIS1, are also inferred to be bound in more than half of the identified SVSP vPERs (Fig. 5A). SOX9 is present and bound in all three PLA2 vPERs, whereas RORA and SPDEF are each bound in two vPERs (Fig. 5A). A TFBS for EHF, which was previously implicated in PLA2 regulation (Nakamura et al. 2014), is putatively bound in a single PLA2 vPER inferred to target both of the highly expressed PLA2 genes (PLA2A1 and PLA2B1) (Fig. 5A). Eight vPERs targeting five of the “other” VGs are found to have candidate TFBSs with evidence of being bound (Supplemental Fig. S15). TBX3 is inferred to be bound to all eight of these vPERs, and multiple additional TFs associated with ERK signaling, including ELF5, EHF, JUN, ATF4, and several FOX family TFs, have evidence of binding a subset of these vPERs. Additionally, several TFs inferred to bind to a subset of vPERs are involved in UPR signaling (ATF4, BHLHA15, and DDIT3::CEBPA) (Supplemental Fig. S15).
TFBSs in vPERs. TFBSs with evidence for being bound in vPERs of the three major VG families. (A) Diamonds indicate TFBSs inferred to be bound in at least two out of three ATAC-seq replicates based on ATAC-seq footprinting analysis. Size of the diamond corresponds to the number of bound TFBSs inferred in a given promoter (larger = more bound sites). Log-scaled gene expression is shown above, and membership to relevant functional categories and TF families is shown on the right. For vPERs that target multiple genes, the averaged gene expression of target genes is shown (pink bars). Genes for which no bound TFBSs were identified in the promoter are not shown. (B) An example alignment of vPER regions for SVMPs. Colored bars indicate bound TFBSs, with bar height scaled by ATAC-seq footprint score (evidence of site being bound). Bars above and below the line indicate TFBSs inferred on the forward and reverse strand, respectively. Expression of target genes is shown on the right, and the consensus score for the alignment is shown below. SVMP vPERs with no bound TFBSs are not shown.
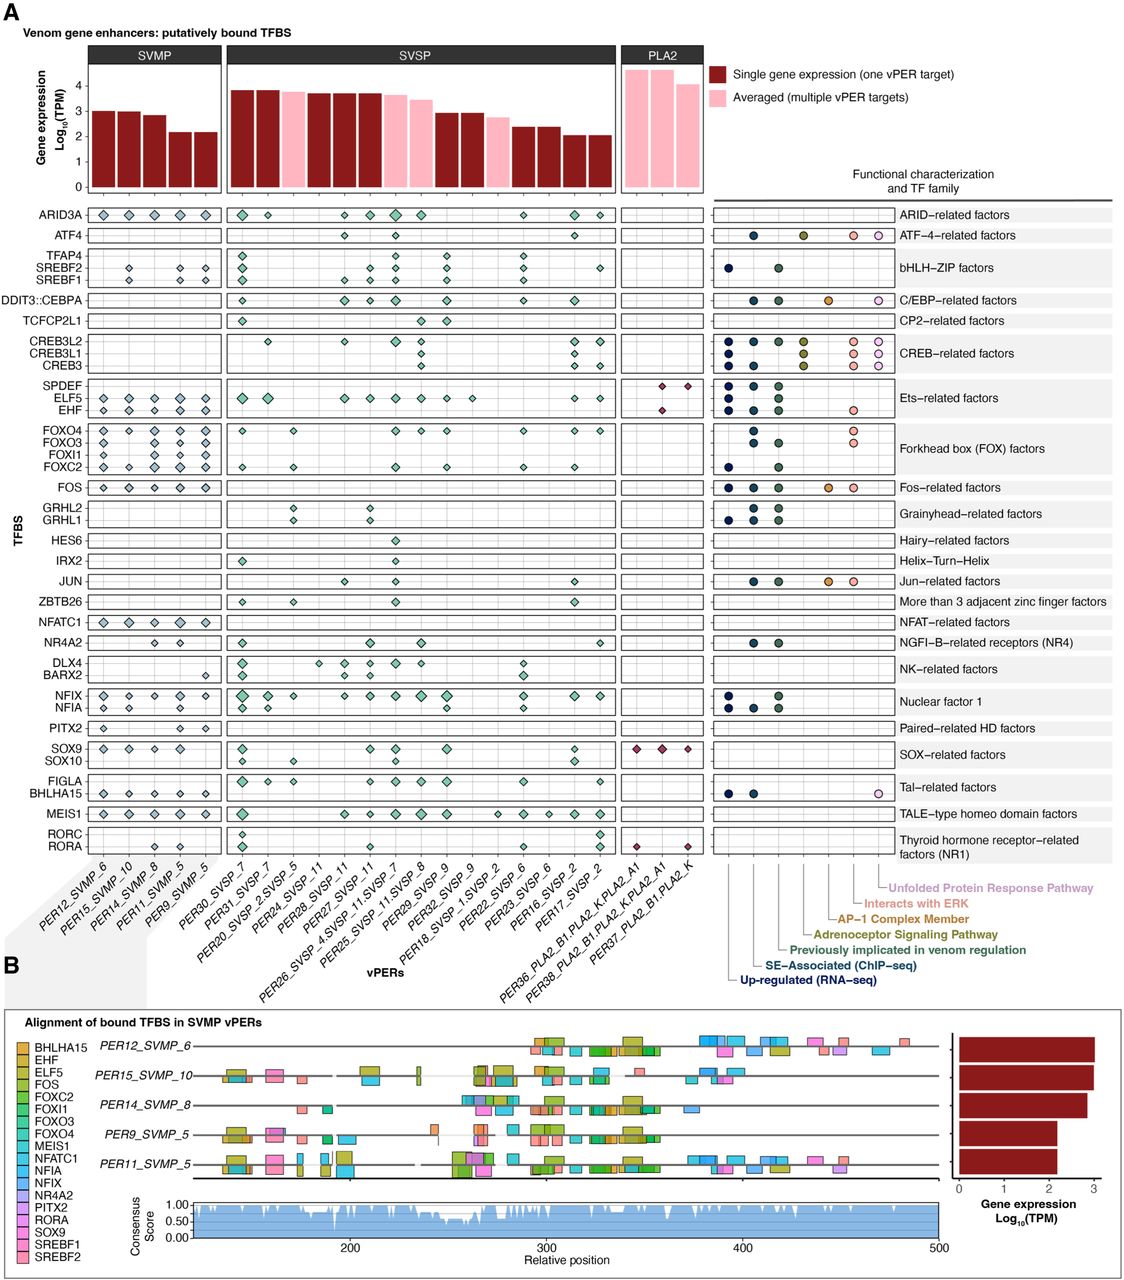
Multiple TFs with putatively bound TFBSs in vPERs of one or more VG families have known associations with ERK signaling (Fig. 5A, right). Candidate TFBSs inferred to be bound in “other” VG vPERs and with known interactions with ERK include TBX3, which is inferred to be bound in all “other” vPERs, among others (Supplemental Fig. S15). TFs involved in the UPR pathway are found to primarily bind to vPERs for SVSPs (Fig. 5A), although BHLHA15 is inferred to bind all SVMP vPERs and a vPER interacting with one “other” VG vPER (CRISP 1) (Supplemental Fig. S15), and DDIT3 is inferred to bind to vPERs for CRISP 1 and Vespryn (Supplemental Fig. S15).
Within each VG family, multiple vPERs show considerable sequence similarity (Supplemental Figs. S16, S17). This is most evident for SVMP vPERs, the majority of which align well and show conserved positioning of many putatively bound TFBSs (Supplemental Fig. S16A). Among PLA2 vPERs, two vPERs align considerably well (vPER37 and vPER38) (Supplemental Fig. S16B); both of these vPERs are inferred to regulate PLA2B1, and vPER38 putatively regulates both PLA2A1 and PLA2B1. Less consistent similarity is observed among SVSP vPERs, and only a subset of vPERs aligns reasonably well (Supplemental Fig. S17B). We explore SVSPs further below. Alignments of SVMP, SVSP, and PLA2 vPERs were manually trimmed to the most consistently homologous regions; a consensus sequence for these was generated to represent a representative “core” enhancer sequence for each VG family (Supplemental Fig. S17).
De novo motif analysis identified one unannotated motif that is enriched in putatively bound regions of vPERs compared with regions in nonvenom gene PERs (Supplemental Table S4), although this motif is not present in all vPERs. This motif shows sequence similarity to ETS-related factor TFBS motifs (Supplemental Table S4); several candidate TFs within this TF family are enriched and putatively bound in all three major venom families (Fig. 5A).
VG enhancer sequences are conserved across species
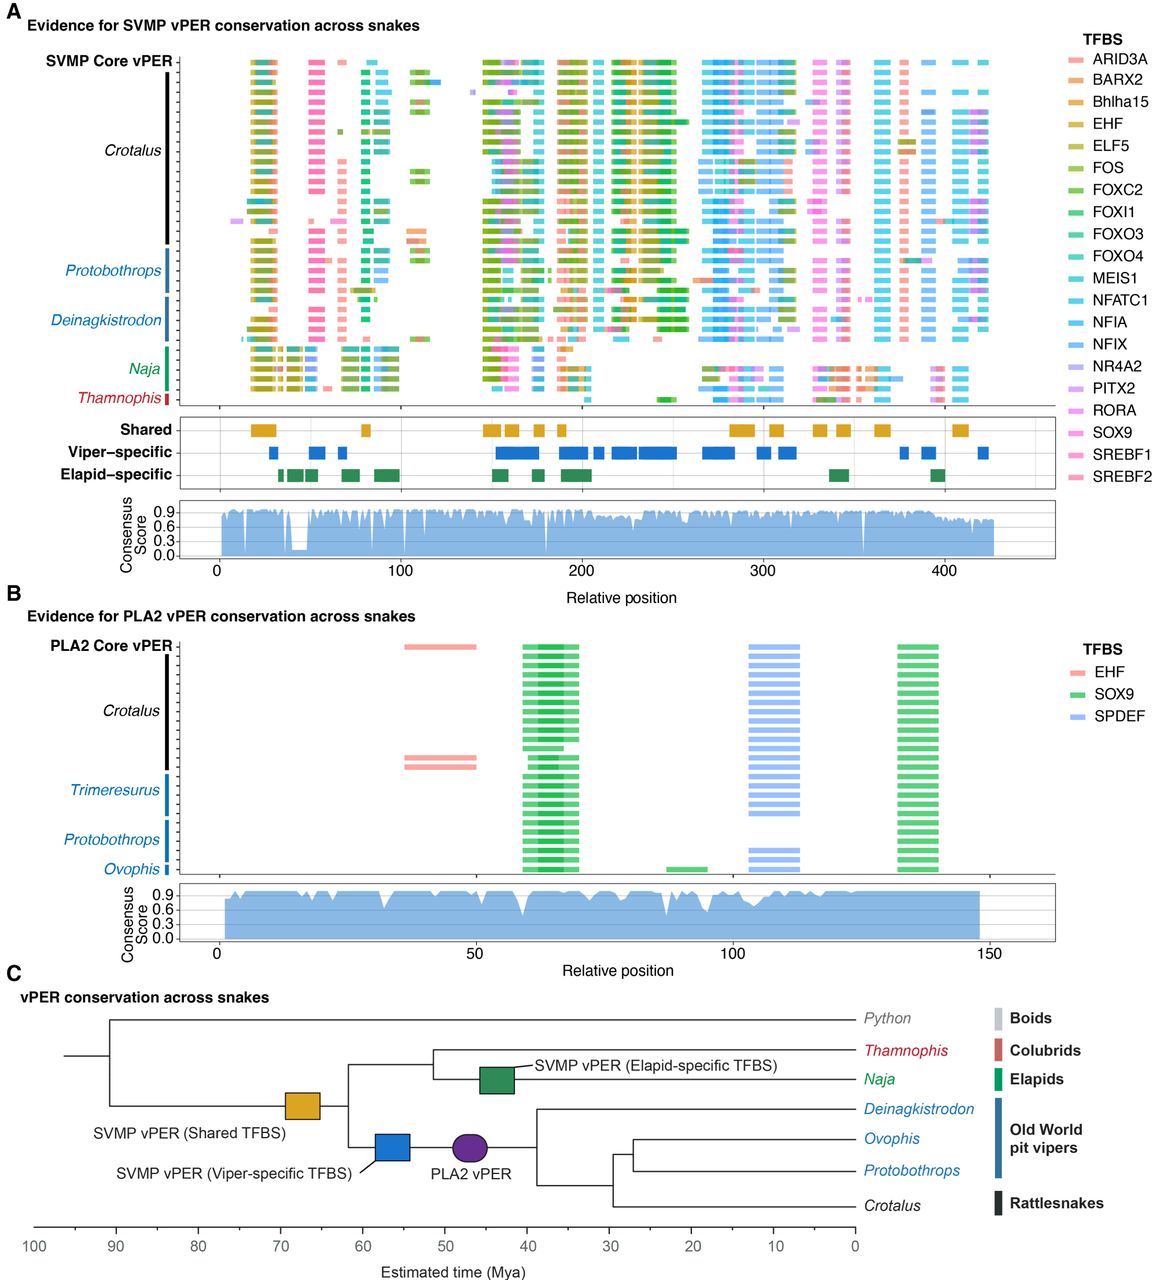
Consistent with evidence that vPERs are relevant regulatory sequences, we found high-similarity hits to prairie rattlesnake core vPER sequences in other venomous snake species, suggesting that vPER sequences for SVMP and PLA2 are conserved among distantly related lineages (Fig. 6A,B; Supplemental Figs. S18, S19; Supplemental Table S6). Many of these orthologous sequences show substantial sequence similarity within pit vipers, including conservation of predicted TFBSs among species spanning at least ∼40 million yr (MY) of divergence (Fig. 6; Kumar et al. 2017). We also identified similar sequences to the SVMP core vPER in a cobra (Naja naja) and a rear-fanged colubrid (Thamnophis sirtalis), suggesting a degree of conservation of this enhancer sequence across ∼70 MY of divergence (Fig. 6A,C). Many TFBS positions in BLAST hits to the SVMP vPER were present in the majority of both viperid and elapid sequences (“shared” in Fig. 6A; Supplemental Fig. S19). Other TFBSs are specific to either viperid or elapid sequences, suggesting independent gain (or differential retention) of TFBSs in these distinct lineages (“viper-specific” and “elapid-specific” in Fig. 6A; Supplemental Fig. S19). These include several TFs with direct interactions to ERK (EHF, FOS, FOXO3, and FOXO4) and one UPR-related TF (BHLHA15; Supplemental Fig. S19). Evaluating the conservation of vPERs associated with the SVSP cluster was not feasible because of the high-copy number of this vPER sequence in the rattlesnake and in other snake genomes, which we explore in detail below.
Conservation of putative VG enhancer sequences across snakes. Alignment and conservation of TFBSs in putative VG enhancer regions (vPERs) among species of venomous snakes for SVMPs (A) and PLA2 vPERs (B). In A, shared and lineage-specific TFBSs between viperid (Crotalus, Protobothrops, and Deinagkistrodon) and elapid (Naja) sequences are indicated below the alignment. (C) Tree indicating divergence of venomous snake lineages and a hypothesis for the origin and conservation of SVMP and PLA2 PERs.
vPERs are not associated with nonvenom paralogs
We surveyed the prairie rattlesnake genome, and nonvenom paralogs specifically, for the presence of sequences similar to vPER regions for the three major VG families (Supplemental Methods). For PLA2s and SVMPs, BLAST only returned hits to the immediate VG clusters, most of which are hits to other identified vPERs (Supplemental Fig. S20A,C). In the SVMP region, one BLAST hit is upstream of SVMP 11 (Supplemental Fig. S20A). This hit is located near the annotated nonvenom SVMP paralogs adjacent to the SVMP cluster, although it does not occur within an ATAC-seq or H3K27ac peak and therefore is unlikely to act as an enhancer in the venom gland. For PLA2 vPERs, BLAST identified a region spanning the third exon of the PLA2gIIe nonvenom paralog with high similarity to the core PLA2 vPER sequence (Supplemental Fig. S20C). Conversely, the SVSP core vPER BLAST search returned approximately 10,000 genome-wide hits (Supplemental Figs. S20B, S21).
SVSP regulatory sequences are associated with transposable elements
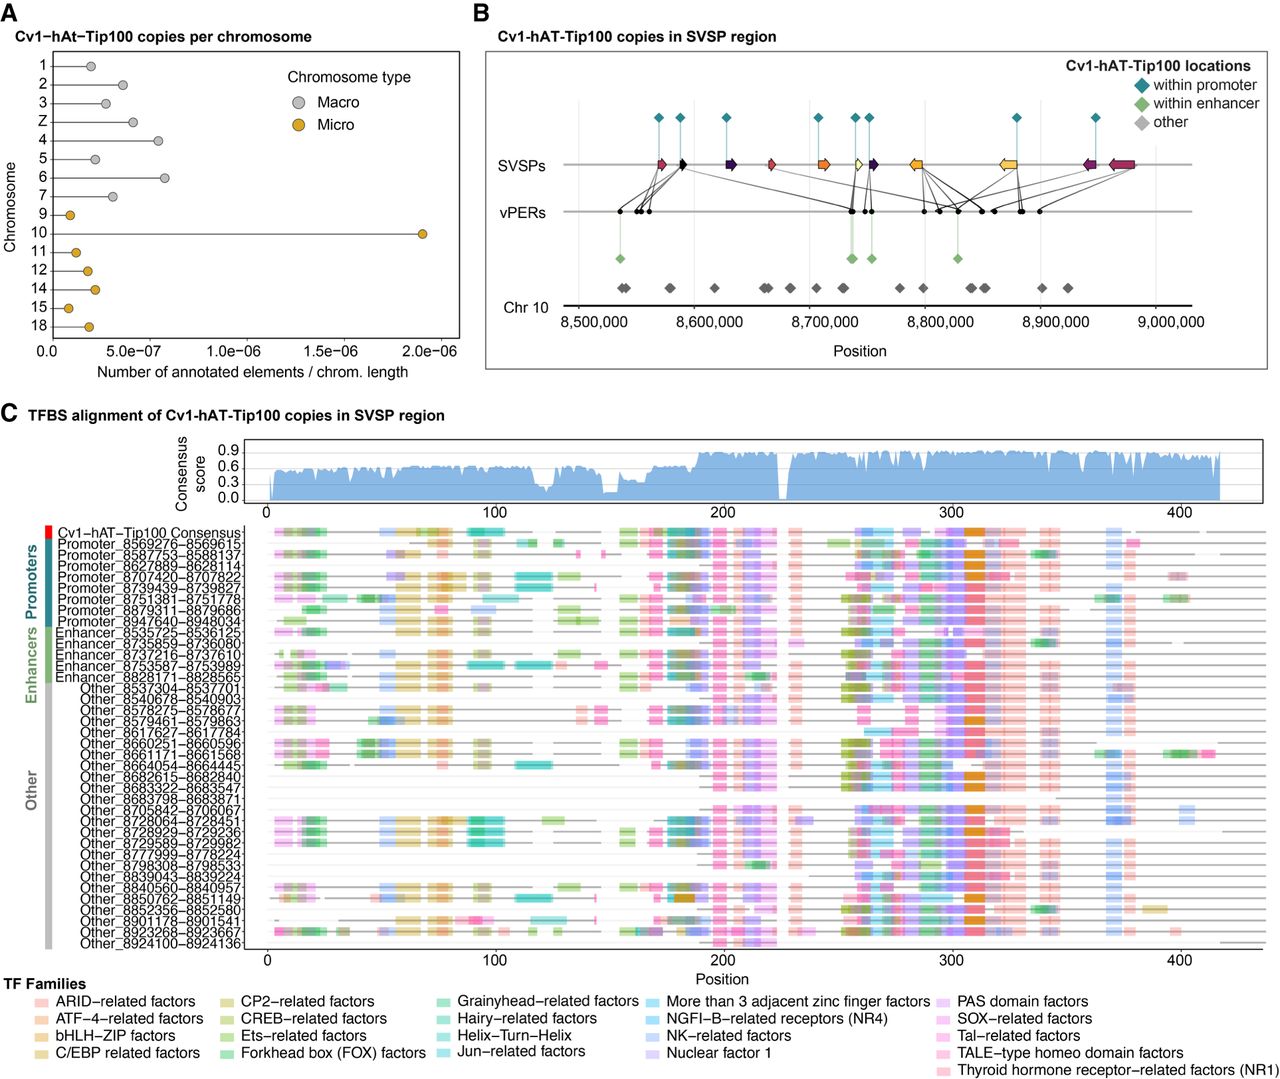
The core SVSP vPER sequence yielded numerous genome-wide BLAST hits against the Crotalus viridis genome, suggesting it may be related to a repetitive element. We investigated potential links between SVSP vPER sequences and transposable elements (TEs) by comparing SVSP vPER sequences to annotated TEs from the prairie rattlesnake (Schield et al. 2019) and other snakes (Pasquesi et al. 2018). Although TEs are abundant in all three major VG clusters, only the SVSP region showed an elevated abundance of annotated repeats compared to the chromosomal median (Supplemental Fig. S22A). Further, multiple SVSP vPER sequences share high homology with the consensus sequence of an annotated DNA transposon (a DNA-hAT-Tip100; referred to hereafter as Cv1-hAT-Tip100). This TE sequence is significantly enriched for overlap with SVSP promoters and vPERs compared to the genomic background (one-tailed Fisher's exact test; P = 5.27 × 10⁻¹⁴) and is prevalent on Chromosome 10, which houses the SVSP cluster (Fig. 7A). Cv1-hAT-Tip100 elements are abundant within the SVSP array, with eight of 11 SVSP promoters and five of 17 vPERs overlapping one or more Cv1-hAT-Tip100 elements (Fig. 7B). Sequence divergence estimates between genome-wide Cv1-hAT-Tip100 elements and those in the SVSP region indicate that these Cv1-hAT-Tip100s were active/inserted within the last 75 MY (Supplemental Fig. S23). Multiple TFBSs predicted to be important to SVSP regulation are present in the estimated ancestral consensus Cv1-hAT-Tip100 sequence and are largely conserved in the SVSP region copies (Fig. 7C). There are also multiple instances in which a small number of single-base substitutions from the consensus have potentially led to the gain/loss of new TFBSs in SVSP Cv1-hAT-Tip100 elements implicated as regulatory sequences (Fig. 7C). Although several repeat elements overlap to some extent with particular vPERs or promoters in SVMP and PLA2 regions, none of these repeats show consistent and broad overlap with multiple regulatory regions as seen in the SVSP region (Supplemental Fig. S22B–D).
DNA transposons have rewired SVMP venom cluster regulatory networks. (A) Cv1-hAT-Tip100 copies per chromosome in the prairie rattlesnake, normalized by chromosome length. (B) SVSP gene array and vPER inferences, with Cv1-hAT-Tip100 copies shown as colored diamonds. (C) Alignment of SVSP-local Cv1-hAT-Tip100 copies with the genome-wide consensus. TFBSs enriched in SVSP promoters or enhancers are colored based on TF families. Faded regions represent alignment gaps.
Chromatin organization contributes to the precision of venom regulation
We inferred topologically associated domains (TADs) and chromatin loops using Hi-C data from 1DPE venom glands (Schield et al. 2019) and incorporated CTCF ChIP-seq data to investigate the role of CTCF binding and insulation in VG regions (Fig. 8). Only the PLA2 VG cluster falls entirely within a single TAD, with SVMP and SVSP clusters each spanning multiple TADs (Fig. 8A,B). The most highly expressed genes in the SVMP cluster (SVMP 6–10) occupy a single TAD, which also contains nearly all H3K27ac and H3K4me3 ChIP-seq peaks in this region, suggesting regulatory isolation of highly expressed genes (Fig. 8B). The most highly expressed SVSPs are also within a single TAD along with several lowly expressed SVSPs. Two other lowly expressed SVSPs (SVSP 1 and SVSP 2) are contained within an adjacent TAD (Fig. 8B).
Chromatin structure and organization associated with VG arrays. (A) Hi-C interaction heatmap (10-kb resolution) of 2-Mb regions centered on VG arrays. Brighter colors indicate higher contact frequency. (B) Topologically associated domains (TADs) across VG arrays. (C) CTCF ChIP-seq density, with black bars at the top indicating ChIP-seq peaks and triangles indicating peaks centered on a verified CTCF binding site. (D) Chromatin loops inferred from Hi-C data that span VG arrays. Red loops indicate CTCF–CTCF bound loops, defined by the presence of a CTCF ChIP-seq peak centered around a CTCF motif within 10 kb of both chromatin loop ends. (E) Venom array genes and inferred vPER-promoter interactions. (F) Simplified ChIP-seq and ATAC-seq data, with points indicating the location of ChIP/ATAC-seq peaks and yellow bars indicating SEs if present. (G) Hypotheses for three-dimensional loop structures of VG regions.
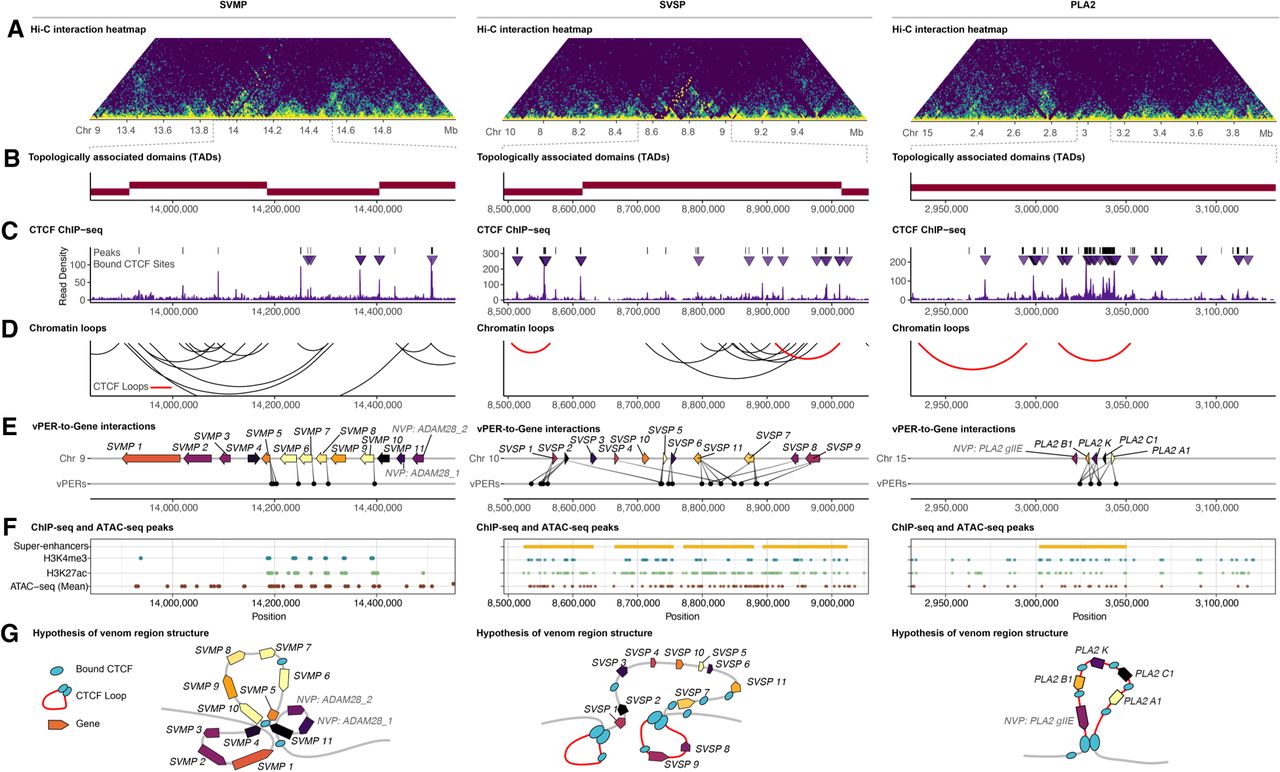
Only the relatively small PLA2 cluster is contained within a single CTCF-bound chromatin loop (Fig. 8D). Numerous chromatin loops in the SVMP and SVSP regions indicate more complex regulatory substructure in these clusters (Fig. 8D). Evidence for bound CTCF is frequent within major VG regions despite not always occurring terminal ends of inferred chromatin loops (Fig. 8C,D), possibly indicating other regulatory roles of CTCF in these regions. Multiple “other” VGs are contained within chromatin loops, many of which were inferred to be CTCF bound (Supplemental Figs. S24–S32).
The two lowly expressed nonvenom paralogs adjacent to the SVMP cluster occupy a TAD that is distinct from highly expressed SVMPs, and chromatin loops suggest that they are excluded from the loop housing active SVMP genes (Fig. 8D,E). In contrast, the nonvenom paralog in the PLA2 cluster (PLA2gIIE) resides within the same TAD, SE, and CTCF-bound loop (Fig. 8D–F). This paralog also shows higher expression in the venom gland compared with nonvenom tissues, consistent with being “linked” to, or at least not entirely isolated from, venom PLA2 regulatory mechanisms (Fig. 1B). Hypotheses are illustrated for local chromatin structure of each venom cluster in Figure 8G based on inferences from TAD, chromatin loop, CTCF binding, and gene expression data sets.
Discussion
Key discoveries in this study frame a model of the regulatory architecture underlying snake venom systems and provide an example of how multiple genomic mechanisms may together establish a novel regulatory system for a polygenic trait. Our findings provide evidence for evolutionary co-option of the ERK and UPR pathways, acting through a suite of TFs that bind promoters and newly discovered enhancer sequences, in the regulation of venom expression (Fig. 9A,B). We also provide new evidence for patterns of chromatin accessibility and genomic organization that direct the precise regulation of snake venom production. Together, our findings reveal that distinct genomic processes and features, including tandem duplication, compact regulatory structure, and the seeding of nascent regulatory sequences by TEs, likely contributed to the evolution of novel regulatory mechanisms in different VG families.
Model of venom regulatory network. (A) Hypothesis regulatory network that controls venom regulation through high-level regulatory action of ERK signaling. Red arrows indicate enhancer–promoter interactions. (B) Illustration of hypothesized positive-feedback loop in which venom production activates the UPR, which in turn increases venom production through up-regulation and binding of UPR TFs that target VGs (red arrows).
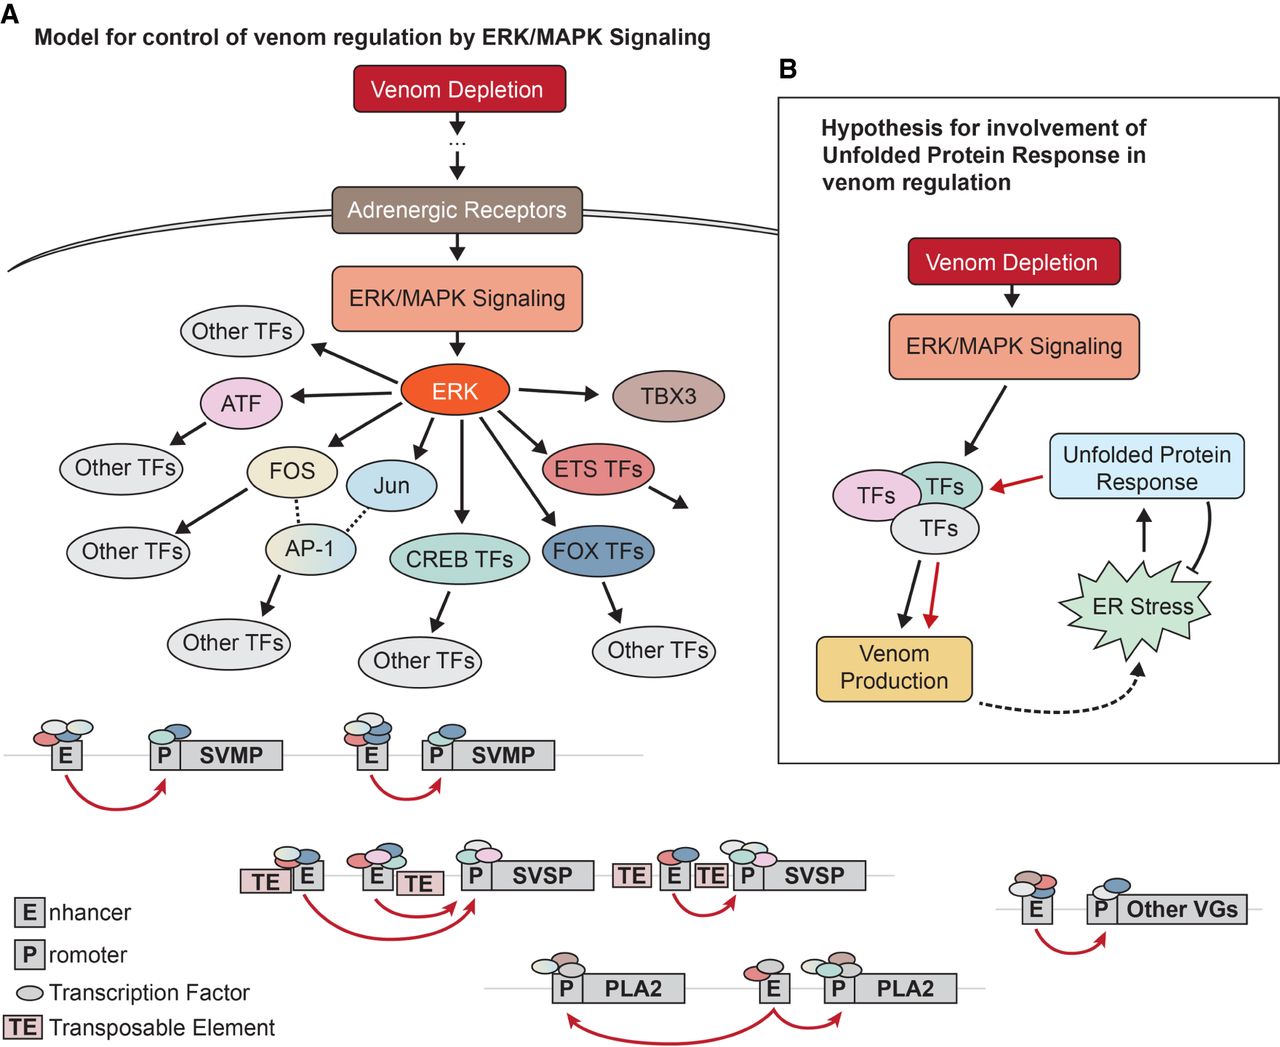
Our findings support a model in which different VG families evolved regulatory connections to common upstream signaling networks triggered by venom depletion (ERK signaling) and further enhanced by cellular stress responses (UPR signaling). This overarching regulatory network involves many TFs previously speculated to be involved in venom regulation in different gene families and species, and links preliminary findings from independent studies with newly identified mechanisms to explain the global regulation of a venom system (Fig. 9A). Additionally, many TFs identified (e.g., AP-1 components, CREB3, and FOX family TFs) are “pioneer” TFs that regulate local chromatin accessibility and recruit histone modifying proteins, and may therefore directly regulate chromatin structure and accessibility required for the expression of VGs (Biddie et al. 2011; Zaret and Carroll 2011; Fane et al. 2017; Jacobs et al. 2018; Khan and Margulies 2019).
We primarily focused on larger VG families because within-family comparisons enabled more powerful inferences of the importance of signaling pathways and TFBSs regulating venom. However, we find that many “other” VGs that do not occur in large multigene arrays also show evidence for regulation by ERK- and UPR-related TFs (Supplemental Fig. S15), suggesting that more than 10 gene families have been independently integrated into this common regulatory network (e.g., Fig. 9).
Regulation of gene expression in eukaryotes is dependent on many factors, including cis-regulatory sequences, the chromatin state of these sequences, and the three-dimensional loop structures that promote or restrict transcription (Cremer and Cremer 2001; Cremer et al. 1993). We identified multiple TADs in VG clusters, indicating a degree of isolation between and interaction within subsets of genes in the two larger families (SVMP and SVSP), whereas the entire PLA2 cluster occupies the center of a large TAD and may be isolated from adjacent genes by a CTCF loop. No inferred CTCF-insulated loops spanned the entire SVMP and SVSP clusters, but we found evidence for chromatin loops and bound CTCF sites in these regions that may play roles in directing enhancer–promoter activity. Accordingly, lowly expressed nonvenom paralogs adjacent to the SVMP cluster are physically isolated from SVMPs via a TAD boundary and chromatin loops. Meanwhile, the PLA2 nonvenom paralog is contained within a CTCF loop along with venom PLA2s and shows higher expression in the venom gland than in nonvenom tissues despite having no known function in secreted venom.
The evolution of novel enhancers that recruit existing regulatory networks has been shown as a mechanism that can enable the evolution of new phenotypes (Rebeiz and Tsiantis 2017; Thompson et al. 2018). Here, we provide the first identification of putative enhancer sequences involved in VG regulation that appear to be novel and specific to venomous snakes, broadly fitting this model for the evolution of novelty. We also show that the regulatory sequences of VGs are relatively compact, with enhancers typically occurring in close proximity to target genes (see also Hargreaves et al. 2014a). Tandem duplication of VGs appears to have often included the duplication of these nearby novel enhancer sequences (this is particularly apparent in the SVMP cluster) (Fig. 3), resulting in the propagation of duplicated genes that are “prewired” with these enhancers. Accumulating evidence for high structural diversity in venom regions between populations and species suggests that ectopic recombination and gene conversion may further reshuffle regulatory regions within VG clusters (Dowell et al. 2016; Giorgianni et al. 2020). Related to this hypothesis, we show that enhancer sequences putatively regulating PLA2s are associated with, and perhaps derived from, exonic debris resulting from incomplete duplication of the nonvenom paralog PLA2gIIe (Supplemental Fig. S33; see also Koludarov et al. 2020). We also find evidence of homologous SVMP enhancer sequences in other elapid and viperid snakes (Fig. 6A). A subset of predicted TFBSs is conserved between these lineages (including ERK-associated TFs EHF, FOS, and FOXO4), whereas others are lineage specific. This suggests that a portion of the SVMP enhancer evolved early in the ancestor of elapids and viperids, then was further modified in parallel, including gains (or differential retention) of TFBSs for the same TFs at nonorthologous positions in both lineages (Supplemental Fig. S19). These lineage-specific differences in putative SVMP enhancers are also consistent with divergent functionality of SVMPs in elapids and viperids (Guan et al. 2010). In contrast to SVMPs, viperid PLA2 enhancers are conserved in elapids, which is also consistent with the expansion of distinct PLA2 VG lineages in elapids (PLA2 type IA) and vipers (PLA2 type IIA/IIB) (Schaloske and Dennis 2006; Zambelli et al. 2017) and suggests independent evolution of enhancers for these two PLA2 lineages.
In the context of eukaryotic gene regulation, prominent examples of large-scale regulatory rewiring have emphasized the roles of TEs in seeding regulatory elements, with recent studies reinforcing that TEs are often co-opted for the regulation of host genes (Feschotte 2008; Ellison and Bachtrog 2013; Lynch et al. 2015; Chuong et al. 2016, 2017). Our findings provide another compelling example of TEs facilitating the rewiring of regulatory networks that underlie novel traits. We show that hAT-Tip100 DNA transposons contributed promoter and enhancer sequences that appear to play integral roles in the regulation SVSPs, one of the largest VG families in the prairie rattlesnake. In addition to the roles of TEs in regulatory rewiring of SVSPs, TEs also tend to be abundant in SVMP and PLA2 VG regions, yet no specific TE shows overlap with numerous regulatory sequences in these regions, which contrasts findings for SVSPs (Supplemental Fig. S22). However, TEs have likely contributed in other ways to the evolution of SVMPs, PLA2s, and other venom loci by enhancing opportunities for nonhomologous recombination and thereby promoting gene duplication (Castoe et al. 2011; Kent et al. 2017; Schield et al. 2021).
Beyond those derived from TEs, most regulatory elements of VGs are not enriched in nonvenom paralogs, although the presence of TFBS sequences in some nonvenom paralog promoters suggests that the “raw material” for certain functional TFBSs may have been present before the duplication and neofunctionalization of VGs. Evidence outside our work here also suggests that a subset of nonvenom paralogs may have already been partially responsive or “prewired” to ERK signaling (e.g., matrix metalloproteinases related to SVMPs) (Arai et al. 2003). Other TFBSs likely evolved de novo and were further propagated by tandem duplications retaining compact cis-regulatory sequences. The diverse set of TFs implicated in venom regulation in this study and the overarching regulation of these and many other vertebrate TFs by ERK and UPR signaling suggest that there is broad sequence space across which de novo mutations can produce TFBSs that are targeted by ERK- and/or UPR-controlled TFs. This example illustrates another potential strategy that may enable novel regulatory network evolution, through the co-option of existing pathways that control many downstream TFs, which collectively target a broad spectrum of potential TFBSs.
The UPR is typically activated in response to stress on the endoplasmic reticulum (ER) resulting from high magnitudes of protein production; the rapid replenishment of venom components following depletion is expected to induce a high magnitude of stress on the ER, and recent studies have shown activation of the UPR during venom production (Perry et al. 2020; Barua and Mikheyev 2021). An intriguing question regarding the involvement of the UPR in venom regulation is whether there is an evolutionary advantage to linking the activation of venom production with mechanisms to alleviate cellular and ER stress, thereby ensuring that venom components are produced efficiently and in the correct conformation. Further, the involvement of TFs activated by the UPR in regulating VGs may suggest a degree of positive feedback in which initial activation of venom production and resulting cellular stress activate the UPR, which in turn activates TFs that further contribute to the transcription of VGs; in this case, full up-regulation of VGs would only occur once the UPR is activated and able to alleviate associated cellular stresses (Fig. 9B). Stress response pathways have also been implicated in other extreme adaptations in snakes, including regenerative organ growth upon feeding (Andrew et al. 2017; Perry et al. 2019; Westfall et al. 2022), highlighting the potential importance of stress response mechanisms in the evolution of novel cellular and physiological traits by reducing the constraints imposed by cellular stress (Wagner et al. 2019).
Our findings provide new insight into the evolution and regulation of snake venom systems. We provide the first regulatory model for snake venom systems and explain the mechanism underlying the polygenic recruitment of multiple VG families. This work suggests that diverse genomic mechanisms led to the co-option and integration of two conserved vertebrate regulatory pathways to coordinate the precise expression of multiple VG families. The resolution of an overarching snake venom regulatory network highlights the utility of venom systems as models for investigating the origins of regulatory networks in general (Casewell et al. 2012, 2013; Post et al. 2020; Zancolli and Casewell 2020) and makes foundational progress toward closing a long-standing gap in our understanding of snake venom systems and their origins.
In a broader context, our findings provide perspectives on how novel regulatory networks evolve and how various evolutionary genomic mechanisms impose or reduce constraints on this process. The rewiring of regulatory networks through the evolution of novel enhancers and other cis-regulatory elements has been hypothesized as an evolutionarily favorable mechanism for the generation of novel regulatory networks that minimizes pleiotropic impacts, in contrast to modification of trans-regulatory factors (Carroll 1995; Wray et al. 2003; Wray 2007). Our finding that snake venom evolution involved novel enhancer sequences with connections to existing regulatory networks (ERK and UPR) provides a key example reinforcing this theory. Previous work has also suggested that the integration of multiple gene regulatory networks can generate new regulatory architectures capable of producing integrated regulatory outputs from multiple stimuli (Rebeiz et al. 2015). Evidence that snake venom regulation has co-opted ERK and UPR pathways suggests that integration of such pathways may be important in producing dynamic regulatory output that responds to both venom depletion (via ERK activation) and cellular stress (UPR) (Fig. 9). Additionally, evidence that snake VGs are associated with novel TADs and distinct chromatin loops that contribute to the precision of venom regulation highlights chromatin conformation as a critical component of regulatory complexity that may impose further constraints on the evolution of novel gene regulatory networks.
Methods
Tissue sampling
Venom gland (sampled 1 d following manual venom extraction), pancreas, stomach, and/or liver tissue samples were collected from three adult prairie rattlesnakes (C. viridis viridis) (for additional detail, see Supplemental Table S1). All animals were housed and sampled at the University of Northern Colorado under approved and registered IACUC protocols. For details, see Supplemental Methods. For genes with clear homologs to human genes, human nomenclature standards were observed. For genes without human homologs (i.e., venom genes), we have used nomenclature conventions consistent with previous studies of venom genes in the Prairie Rattlesnake and related species (Schield et al. 2019; Perry et al. 2020).
RNA isolation, sequencing, and analyses
Total RNA was extracted from snap-frozen tissues and sequenced on an Illumina NovaSeq using 150-bp paired-end reads. Raw RNA-seq reads were quality trimmed and mapped to the annotated C. viridis genome (NCBI: GCA_003400415.2), and pairwise comparisons were conducted between venom and nonvenom tissues. For subsequent analyses aimed at comparing the relative gene expression between genes in the venom gland, we normalized gene expression counts in the three venom gland replicates to transcripts per million (TPM) and used the median TPM measure across replicates for each gene as its expression in subsequent analyses. For details, see Supplemental Methods.
Hi-C sequencing and analysis
Hi-C data for a C. viridis venom gland at 1 d postextraction was generated previously (NCBI BioProject [https://www.ncbi.nlm.nih.gov/bioproject/] accession number PRJNA413201) (for details, see Schield et al. 2019). For details on Hi-C data processing and analysis, see Supplemental Methods.
ChIP data generation and analysis
ChIP-seq libraries were generated for postextraction (1DPE) venom gland tissue by Active Motif for bound CTCF and histone modifications H3K4me3 and H3K27ac. Basic ChIP-seq data processing was performed by Active Motif using their standard analysis pipeline (for details, see Supplemental Methods). SEs were determined by merging enriched H3K27ac intervals if their inner distance was ≤12,500 bp and by classifying merged regions with the top 5% strongest enrichment as SEs.
ATAC-seq data generation and analysis
ATAC-seq libraries were prepared from snap-frozen venom gland tissue and sequenced on an Illumina NextSeq 500 using 42-bp paired-end reads. ATAC-seq data were processed following Harvard Informatics best practices (for additional details, see Supplemental Methods; https://github.com/harvardinformatics/ATAC-seq). Raw ATAC-seq read coverage was normalized using deepTools v3.1.3 (Ramírez et al. 2016) and edgeR v3.32.1 (Robinson et al. 2010), and Wiggletools 1.2.1 (github.com/Ensembl/WiggleTools) was used to calculate the mean normalized ATAC-seq density across samples. ATAC-seq footprinting analysis was conducted using TOBIAS v.0.12.4 (Bentsen et al. 2020). For details, see Supplemental Methods.
Identifying candidate TFs
In brief, annotated TFs in the prairie rattlesnake genome were cross-referenced with the results of differential gene expression analyses described above to identify TFs with evidence of up-regulation in the venom gland compared with nonvenom tissues (IHW P-value < 0.05). Separately, we identified TF genes associated with SEs. These two TF sets were merged to form one master set of candidate TFs for subsequent analyses. GO terms and KEGG pathways with overrepresentation in our candidate TF set and known interactions with ERK were assessed with WebGestalt 2019 (Liao et al. 2019) and STRINGdb v11.0 (Szklarczyk et al. 2019), respectively. For additional details, see Supplemental Methods.
Identification of PERs and PER–gene interactions
We used the ABC model v0.2 (Fulco et al. 2019) to identify PERs and infer PER-gene regulatory interactions in the postextraction venom gland. vPERs were defined as PER regions inferred to interact with one or more annotated VGs. To simplify downstream analyses by determining one representative, or “core,” enhancer sequence per VG family, we manually curated vPER alignments within each family. For additional details, see Supplemental Methods.
TFBS prediction, enrichment analyses, and TFBS alignment
TFBS prediction and enrichment analyses were conducted using CiiDER v0.9 (Gearing et al. 2019), and TOBIAS ScoreBed was used to annotate TFBS positions with footprint scores. A given TFBS was considered “bound” if the footprint scores for that position in at least two of the three replicates exceeded the “bound” threshold determined above by Tobias BINDetect. For additional details, see Supplemental Methods.
Novel TFBS motif searches in venom regulatory sequences
We used de novo motif identification analyses in elevated ATAC-seq footprint regions to identify novel TFBS motifs that would not be otherwise detected by our candidate approach described above. Novel motifs were identified and annotated using MEME v5.3.3 (Bailey and Elkan 1994) and TomTom v5.3.3 (Gupta et al. 2007) within the online MEME-ChIP tool v5.3.3 (Machanick and Bailey 2011). For details, see Supplemental Methods.
Identifying potential conserved vPER sequences in other venomous snake species
To investigate whether vPER sequences are conserved in other venomous snakes, we used BLASTN to search all snake nucleotide sequences on NCBI (via the online BLAST platform) and BLASTN in BLAST+ v2.6.0 to search a set of existing snake genome assemblies (see Supplemental Methods). Resulting BLAST hits were aligned, and TFBSs inferred to be bound in corresponding VG family enhancers were scanned using CiiDER. An approximated phylogeny for lineages represented in these analyses was downloaded from TimeTree (Kumar et al. 2017). For additional details, see Supplemental Methods.
Analyses of TEs associated with SVSP regulatory sequences
Using TE annotations from Pasquesi et al. (2018), we used Giggle v0.6.3 (Layer et al. 2018) to test whether SVSP regulatory regions (promoters and vPERs) were significantly enriched for overlap with any particular TE (one-tailed Fisher's exact test; P < 0.05). This analysis identified a DNA/hAT-Tip100 element (Cv1-hAT-Tip100) that was enriched in the SVSP regulatory regions and generally common on Chromosome 10. A genome-wide consensus sequence for this element was generated using MAFFT ( Katoh and Standley 2013) by providing the DNA hAT-Tip100 consensus from the repeat element library as reference. This consensus sequence was manually curated and then used to calculate sequence divergence (pairwise-pi) for all Cv1-hAT-Tip100. For Cv1-hAT-Tip100 copies within the SVSP region, including those in regulatory and “other” intergenic sequences, we used CiiDER to identify TFBSs identified above as bound in SVSP promoters and/or enhancers. These sequences and TFBS positions were then aligned using MAFFT and the custom Python script described above and were plotted in R (R Core Team 2013) using ggplot2 (Wickham 2011). For additional details, see Supplemental Methods.
Data access
All raw and processed sequencing data generated in this study have been submitted to the NCBI Gene Expression Omnibus (GEO; https://www.ncbi.nlm.nih.gov/geo/) under accession number GSE169217. The transcriptomic data for prairie rattlesnake venom gland and body tissues data generated in this study have been submitted to the NCBI BioProject database (https://www.ncbi.nlm.nih.gov/bioproject/) under accession number PRJNA716163. All custom scripts used for data analysis are available as Supplemental Code and at GitHub (https://github.com/blairperry/venomRegulation_2021).
Competing interest statement
The authors declare no competing interests.
Acknowledgments
Support was provided by National Science Foundation (NSF) grants DEB-1655571 (to T.A.C. and S.P.M.), IOS-655735 (to T.A.C.), and DBI-1906188 (to D.R.S.); National Institutes of Health (NIH) 1R35GM128822 (to E.B.C.); and a Research Dissemination and Faculty Development grant from the University of Northern Colorado (to S.P.M.).
Author contributions: B.W.P. and T.A.C. conceived the work and wrote the manuscript. S.S.G., G.I.M.P., D.R.S., and A.K.W. conducted analyses. B.W.P., T.A.C., D.R.S., C.F.S., and S.P.M. generated data. All authors participated in editing the final manuscript.
Notes
[1] Supplementary material [Supplemental material is available for this article.]
[2] Article published online before print. Article, supplemental material, and publication date are at https://www.genome.org/cgi/doi/10.1101/gr.276251.121.
[3] Freely available online through the Genome Research Open Access option.
References
- ↵Andrew AL, Perry BW, Card DC, Schield DR, Ruggiero RP, McGaugh SE, Choudhary A, Secor SM, Castoe TA. 2017. Growth and stress response mechanisms underlying post-feeding regenerative organ growth in the Burmese python. BMC Genomics 18: 338. 10.1186/s12864-017-3743-1
- ↵Arai K, Lee S, Lo EH. 2003. Essential role for ERK mitogen-activated protein kinase in matrix metalloproteinase-9 regulation in rat cortical astrocytes. Glia 43: 254–264. 10.1002/glia.10255
- ↵Babu MM, Luscombe NM, Aravind L, Gerstein M, Teichmann SA. 2004. Structure and evolution of transcriptional regulatory networks. Curr Opin Struct Biol 14: 283–291. 10.1016/j.sbi.2004.05.004
- ↵Bailey TL, Elkan C. 1994. Fitting a mixture model by expectation maximization to discover motifs in biopolymers. Proc Int Conf Intell Syst Mol Biol 2: 28–36.
- ↵Barua A, Mikheyev AS. 2021. An ancient, conserved gene regulatory network led to the rise of oral venom systems. Proc Natl Acad Sci 118: e2021311118. 10.1073/pnas.2021311118
- ↵Bentsen M, Goymann P, Schultheis H, Klee K, Petrova A, Wiegandt R, Fust A, Preussner J, Kuenne C, Braun T. 2020. ATAC-seq footprinting unravels kinetics of transcription factor binding during zygotic genome activation. Nat Commun 11: 4267. 10.1038/s41467-020-18035-1
- ↵Biddie SC, John S, Sabo PJ, Thurman RE, Johnson TA, Schiltz RL, Miranda TB, Sung M-H, Trump S, Lightman SL, 2011. Transcription factor AP1 potentiates chromatin accessibility and glucocorticoid receptor binding. Mol Cell 43: 145–155. 10.1016/j.molcel.2011.06.016
- ↵Carroll SB. 1995. Homeotic genes and the evolution of arthropods and chordates. Nature 376: 479–485. 10.1038/376479a0
- ↵Casewell NR, Huttley GA, Wüster W. 2012. Dynamic evolution of venom proteins in squamate reptiles. Nat Commun 3: 1066. 10.1038/ncomms2065
- ↵Casewell NR, Wüster W, Vonk FJ, Harrison RA, Fry BG. 2013. Complex cocktails: the evolutionary novelty of venoms. Trends Ecol Evol 28: 219–229. 10.1016/j.tree.2012.10.020
- ↵Castoe TA, Hall KT, Mboulas G, Marcel L, Gu W, de Koning AP, Fox SE, Poole AW, Vemulapalli V, Daza JM, 2011. Discovery of highly divergent repeat landscapes in snake genomes using high-throughput sequencing. Genome Biol Evol 3: 641–653. 10.1093/gbe/evr043
- ↵Chuong EB, Elde NC, Feschotte C. 2016. Regulatory evolution of innate immunity through co-option of endogenous retroviruses. Science 351: 1083–1087. 10.1126/science.aad5497
- ↵Chuong EB, Elde NC, Feschotte C. 2017. Regulatory activities of transposable elements: from conflicts to benefits. Nat Rev Genet 18: 71–86. 10.1038/nrg.2016.139
- ↵Cremer T, Cremer C. 2001. Chromosome territories, nuclear architecture and gene regulation in mammalian cells. Nat Rev Genet 2: 292–301. 10.1038/35066075
- ↵Cremer T, Kurz A, Zirbel R, Dietzel S, Rinke B, Schröck E, Speicher MR, Mathieu U, Jauch A, Emmerich P. 1993. Role of chromosome territories in the functional compartmentalization of the cell nucleus. Cold Spring Harb Symp Quant Biol 58: 777–792. 10.1101/sqb.1993.058.01.085
- ↵Delaneau O, Zazhytska M, Borel C, Giannuzzi G, Rey G, Howald C, Kumar S, Ongen H, Popadin K, Marbach D, 2019. Chromatin three-dimensional interactions mediate genetic effects on gene expression. Science 364: eaat8266. 10.1126/science.aat8266
- ↵Dowell NL, Giorgianni MW, Kassner VA, Selegue JE, Sanchez EE, Carroll SB. 2016. The deep origin and recent loss of venom toxin genes in rattlesnakes. Curr Biol 26: 2434–2445. 10.1016/j.cub.2016.07.038
- ↵Ellison CE, Bachtrog D. 2013. Dosage compensation via transposable element mediated rewiring of a regulatory network. Science 342: 846–850. 10.1126/science.1239552
- ↵Fane M, Harris L, Smith AG, Piper M. 2017. Nuclear factor one transcription factors as epigenetic regulators in cancer. Int J Cancer 140: 2634–2641. 10.1002/ijc.30603
- ↵Feschotte C. 2008. Transposable elements and the evolution of regulatory networks. Nat Rev Genet 9: 397–405. 10.1038/nrg2337
- ↵Fry BG, Scheib H, van der Weerd L, Young B, McNaughtan J, Ramjan SFR, Vidal N, Poelmann RE, Norman JA. 2008. Evolution of an arsenal structural and functional diversification of the venom system in the advanced snakes (Caenophidia). Mol Cell Proteomics 7: 215–246. 10.1074/mcp.M700094-MCP200
- ↵Fulco CP, Nasser J, Jones TR, Munson G, Bergman DT, Subramanian V, Grossman SR, Anyoha R, Doughty BR, Patwardhan TA, 2019. Activity-by-contact model of enhancer–promoter regulation from thousands of CRISPR perturbations. Nat Genet 51: 1664–1669. 10.1038/s41588-019-0538-0
- ↵Gearing LJ, Cumming HE, Chapman R, Finkel AM, Woodhouse IB, Luu K, Gould JA, Forster SC, Hertzog PJ. 2019. CiiiDER: a tool for predicting and analysing transcription factor binding sites. PLoS One 14: e0215495. 10.1371/journal.pone.0215495
- ↵Giorgianni MW, Dowell NL, Griffin S, Kassner VA, Selegue JE, Carroll SB. 2020. The origin and diversification of a novel protein family in venomous snakes. Proc Natl Acad Sci 117: 10911–10920. 10.1073/pnas.1920011117
- ↵Guan H-H, Goh K-S, Davamani F, Wu P-L, Huang Y-W, Jeyakanthan J, Wu W, Chen C-J. 2010. Structures of two elapid snake venom metalloproteases with distinct activities highlight the disulfide patterns in the D domain of ADAMalysin family proteins. J Struct Biol 169: 294–303. 10.1016/j.jsb.2009.11.009
- ↵Gupta S, Stamatoyannopoulos JA, Bailey TL, Noble WS. 2007. Quantifying similarity between motifs. Genome Biol 8: R24. 10.1186/gb-2007-8-2-r24
- ↵Hargreaves AD, Swain MT, Hegarty MJ, Logan DW, Mulley JF. 2014a. Genomic and transcriptomic insights into the regulation of snake venom production. bioRxiv 10.1101/008474
- ↵Hargreaves AD, Swain MT, Hegarty MJ, Logan DW, Mulley JF. 2014b. Restriction and recruitment: gene duplication and the origin and evolution of snake venom toxins. Genome Biol Evol 6: 2088–2095. 10.1093/gbe/evu166
- ↵Hnisz D, Abraham BJ, Lee TI, Lau A, Saint-André V, Sigova AA, Hoke HA, Young RA. 2013. Super-enhancers in the control of cell identity and disease. Cell 155: 934–947. 10.1016/j.cell.2013.09.053
- ↵Holding ML, Biardi JE, Gibbs HL. 2016. Coevolution of venom function and venom resistance in a rattlesnake predator and its squirrel prey. Proc Biol Sci 283: 20152841. 10.1098/rspb.2015.2841
- ↵Jacobs J, Atkins M, Davie K, Imrichova H, Romanelli L, Christiaens V, Hulselmans G, Potier D, Wouters J, Taskiran II, 2018. The transcription factor grainy head primes epithelial enhancers for spatiotemporal activation by displacing nucleosomes. Nat Genet 50: 1011–1020. 10.1038/s41588-018-0140-x
- ↵Junqueira-de-Azevedo ILM, Bastos CMV, Ho PL, Luna MS, Yamanouye N, Casewell NR. 2015. Venom-related transcripts from Bothrops jararaca tissues provide novel molecular insights into the production and evolution of snake venom. Mol Biol Evol 32: 754–766. 10.1093/molbev/msu337
- ↵Katoh K, Standley DM. 2013. MAFFT multiple sequence alignment software version 7: improvements in performance and usability. Mol Biol Evol 30: 772–780. 10.1093/molbev/mst010
- ↵Kent TV, Uzunović J, Wright SI. 2017. Coevolution between transposable elements and recombination. Philos Trans R Soc Lond B Biol Sci 372: 20160458. 10.1098/rstb.2016.0458
- ↵Kerchove CM, Carneiro SM, Markus RP, Yamanouye N. 2004. Stimulation of the α-adrenoceptor triggers the venom production cycle in the venom gland of Bothrops jararaca. J Exp Biol 207: 411–416. 10.1242/jeb.00778
- ↵Kerchove CM, Luna MSA, Zablith MB, Lazari MFM, Smaili SS, Yamanouye N. 2008. α1-Adrenoceptors trigger the snake venom production cycle in secretory cells by activating phosphatidylinositol 4,5-bisphosphate hydrolysis and ERK signaling pathway. Comp Biochem Physiol Part A Mol Integr Physiol 150: 431–437. 10.1016/j.cbpa.2008.04.607
- ↵Khan HA, Margulies CE. 2019. The role of mammalian Creb3-like transcription factors in response to nutrients. Front Genet 10: 591. 10.3389/fgene.2019.00591
- ↵Kochva E, Oron U, Ovadia M, Simon T, Bdolah A. 1980. Venom glands, venom synthesis, venom secretion and evolution. In Natural toxins, pp. 3–12. Elsevier, München, Germany.
- ↵Koludarov I, Jackson TNW, Suranse V, Pozzi A, Sunagar K, Mikheyev AS. 2020. Reconstructing the evolutionary history of a functionally diverse gene 2 family reveals complexity at the genetic origins of novelty. bioRxiv 10.1101/583344
- ↵Kumar S, Stecher G, Suleski M, Hedges SB. 2017. TimeTree: a resource for timelines, timetrees, and divergence times. Mol Biol Evol 34: 1812–1819. 10.1093/molbev/msx116
- ↵Layer RM, Pedersen BS, DiSera T, Marth GT, Gertz J, Quinlan AR. 2018. GIGGLE: a search engine for large-scale integrated genome analysis. Nat Methods 15: 123–126. 10.1038/nmeth.4556
- ↵Liao Y, Wang J, Jaehnig EJ, Shi Z, Zhang B. 2019. WebGestalt 2019: gene set analysis toolkit with revamped UIs and APIs. Nucleic Acids Res 47: W199–W205. 10.1093/nar/gkz401
- ↵Luna MSA, Hortencio TMA, Ferreira ZS, Yamanouye N. 2009. Sympathetic outflow activates the venom gland of the snake Bothrops jararaca by regulating the activation of transcription factors and the synthesis of venom gland proteins. J Exp Biol 212: 1535–1543. 10.1242/jeb.030197
- ↵Lynch VJ, Nnamani MC, Kapusta A, Brayer K, Plaza SL, Mazur EC, Emera D, Sheikh SZ, Grützner F, Bauersachs S, 2015. Ancient transposable elements transformed the uterine regulatory landscape and transcriptome during the evolution of mammalian pregnancy. Cell Rep 10: 551–561. 10.1016/j.celrep.2014.12.052
- ↵Machanick P, Bailey TL. 2011. MEME-ChIP: motif analysis of large DNA datasets. Bioinformatics 27: 1696–1697. 10.1093/bioinformatics/btr189
- ↵Mackessy SP. 1991. Morphology and ultrastructure of the venom glands of the northern pacific rattlesnake Crotalus viridis oreganus. J Morphol 208: 109–128. 10.1002/jmor.1052080106
- ↵Mackessy SP. 2021. Handbook of venoms and toxins of reptiles, 2nd ed., p. 652. CRC Press/Taylor & Francis Group, Boca Raton, FL.
- ↵Mackessy SP, Baxter LM. 2006. Bioweapons synthesis and storage: the venom gland of front-fanged snakes. Zool Anz A J Comp Zool 245: 147–159. 10.1016/j.jcz.2006.01.003
- ↵Margres MJ, Rautsaw RM, Strickland JL, Mason AJ, Schramer TD, Hofmann EP, Stiers E, Ellsworth SA, Nystrom GS, Hogan MP, 2021. The tiger rattlesnake genome reveals a complex genotype underlying a simple venom phenotype. Proc Natl Acad Sci 118: e2014634118. 10.1073/pnas.2014634118
- ↵Misteli T. 2007. Beyond the sequence: cellular organization of genome function. Cell 128: 787–800. 10.1016/j.cell.2007.01.028
- ↵Nakamura H, Murakami T, Hattori S, Sakaki Y, Ohkuri T, Chijiwa T, Ohno M, Oda-Ueda N. 2014. Epithelium specific ETS transcription factor, ESE-3, of Protobothrops flavoviridis snake venom gland transactivates the promoters of venom phospholipase A2 isozyme genes. Toxicon 92: 133–139. 10.1016/j.toxicon.2014.10.001
- ↵Pasquesi GIM, Adams RH, Card DC, Schield DR, Corbin AB, Perry BW, Reyes-Velasco J, Ruggiero RP, Vandewege MW, Shortt JA. 2018. Squamate reptiles challenge paradigms of genomic repeat element evolution set by birds and mammals. Nat Commun 9: 2774. 10.1038/s41467-017-02088-w
- ↵Perry BW, Andrew AL, Mostafa Kamal AH, Card DC, Schield DR, Pasquesi GIM, Pellegrino MW, Mackessy SP, Chowdhury SM, Secor SM, 2019. Multi-species comparisons of snakes identify coordinated signalling networks underlying post-feeding intestinal regeneration. Proc Biol Sci 286: 20190910. 10.1098/rspb.2019.0910
- ↵Perry BW, Schield DR, Westfall AK, Mackessy SP, Castoe TA. 2020. Physiological demands and signaling associated with snake venom production and storage illustrated by transcriptional analyses of venom glands. Sci Rep 10: 18083. 10.1038/s41598-020-75048-y
- ↵Post Y, Puschhof J, Beumer J, Kerkkamp HM, de Bakker MAG, Slagboom J, de Barbanson B, Wevers NR, Spijkers XM, Olivier T, 2020. Snake venom gland organoids. Cell 180: 233–247.e21. 10.1016/j.cell.2019.11.038
- ↵Ragoczy T, Telling A, Sawado T, Groudine M, Kosak ST. 2003. A genetic analysis of chromosome territory looping: diverse roles for distal regulatory elements. Chromosom Res 11: 513–525. 10.1023/A:1024939130361
- ↵Ramírez F, Ryan DP, Grüning B, Bhardwaj V, Kilpert F, Richter AS, Heyne S, Dündar F, Manke T. 2016. deepTools2: a next generation web server for deep-sequencing data analysis. Nucleic Acids Res 44: W160–W165. 10.1093/nar/gkw257
- ↵R Core Team. 2013. R: a language and environment for statistical computing. R Foundation for Statistical Computing, Vienna. https://www.R-project.org/.
- ↵Rebeiz M, Tsiantis M. 2017. Enhancer evolution and the origins of morphological novelty. Curr Opin Genet Dev 45: 115–123. 10.1016/j.gde.2017.04.006
- ↵Rebeiz M, Patel NH, Hinman VF. 2015. Unraveling the tangled skein: the evolution of transcriptional regulatory networks in development. Annu Rev Genomics Hum Genet 16: 103–131. 10.1146/annurev-genom-091212-153423
- ↵Robinson MD, McCarthy DJ, Smyth GK. 2010. edgeR: a Bioconductor package for differential expression analysis of digital gene expression data. Bioinformatics 26: 139–140. 10.1093/bioinformatics/btp616
- ↵Rokyta DR, Margres MJ, Calvin K. 2015. Post-transcriptional mechanisms contribute little to phenotypic variation in snake venoms. G3 (Bethesda) 5: 2375–2382. 10.1534/g3.115.020578
- ↵Sandelin A, Alkema W, Engström P, Wasserman WW, Lenhard B. 2004. JASPAR: an open-access database for eukaryotic transcription factor binding profiles. Nucleic Acids Res 32: D91–D94. 10.1093/nar/gkh012
- ↵Saviola AJ, Pla D, Sanz L, Castoe TA, Calvete JJ, Mackessy SP. 2015. Comparative venomics of the prairie rattlesnake (Crotalus viridis viridis) from Colorado: identification of a novel pattern of ontogenetic changes in venom composition and assessment of the immunoreactivity of the commercial antivenom CroFab®. J Proteomics 121: 28–43. 10.1016/j.jprot.2015.03.015
- ↵Schaloske RH, Dennis EA. 2006. The phospholipase A2 superfamily and its group numbering system. Biochim Biophys Acta 1761: 1246–1259. 10.1016/j.bbalip.2006.07.011
- ↵Schield DR, Card DC, Hales NR, Perry BW, Pasquesi GM, Blackmon H, Adams RH, Corbin AB, Smith CF, Ramesh B, 2019. The origins and evolution of chromosomes, dosage compensation, and mechanisms underlying venom regulation in snakes. Genome Res 29: 590–601. 10.1101/gr.240952.118
- ↵Schield DR, Perry BW, Pasquesi GIM, Orton RW, Nikolakis ZL, Westfall AK, Castoe TA. 2021. Applications of genomics and related technologies for studying reptile venoms. In Handbook of venoms and toxins of reptiles, pp. 29–42. CRC Press, Boca Raton, FL.
- ↵Szklarczyk D, Gable AL, Lyon D, Junge A, Wyder S, Huerta-Cepas J, Simonovic M, Doncheva NT, Morris JH, Bork P, 2019. STRING v11: protein–protein association networks with increased coverage, supporting functional discovery in genome-wide experimental datasets. Nucleic Acids Res 47: D607–D613. 10.1093/nar/gky1131
- ↵Teichmann SA, Babu MM. 2004. Gene regulatory network growth by duplication. Nat Genet 36: 492–496. 10.1038/ng1340
- ↵Thompson AC, Capellini TD, Guenther CA, Chan YF, Infante CR, Menke DB, Kingsley DM. 2018. A novel enhancer near the Pitx1 gene influences development and evolution of pelvic appendages in vertebrates. eLife 7: e38555. 10.7554/eLife.38555
- ↵Vonk FJ, Casewell NR, Henkel CV, Heimberg AM, Jansen HJ, McCleary RJ, Kerkkamp HM, Vos RA, Guerreiro I, Calvete JJ, 2013. The king cobra genome reveals dynamic gene evolution and adaptation in the snake venom system. Proc Natl Acad Sci 110: 20651–20656. 10.1073/pnas.1314702110
- ↵Wagner GP, Lynch VJ. 2010. Evolutionary novelties. Curr Biol 20: R48–R52. 10.1016/j.cub.2009.11.010
- ↵Wagner GP, Erkenbrack EM, Love AC. 2019. Stress-induced evolutionary innovation: a mechanism for the origin of cell types. Bioessays 41: 1800188. 10.1002/bies.201800188
- ↵Westfall AK, Perry BW, Kamal AHM, Hales NR, Kay JC, Sapkota M, Schield DR, Pellegrino MW, Secor SM, Chowdhury SM, 2022. Identification of an integrated stress and growth response signaling switch that directs vertebrate intestinal regeneration. BMC Genomics 23: 6. 10.1186/s12864-021-08226-5
- ↵Whyte WA, Orlando DA, Hnisz D, Abraham BJ, Lin CY, Kagey MH, Rahl PB, Lee TI, Young RA. 2013. Master transcription factors and mediator establish super-enhancers at key cell identity genes. Cell 153: 307–319. 10.1016/j.cell.2013.03.035
- ↵Wickham H. 2011. ggplot2. Wiley Interdiscip Rev Comput Stat 3: 180–185. 10.1002/wics.147
- ↵Wray GA. 2007. The evolutionary significance of cis-regulatory mutations. Nat Rev Genet 8: 206–216. 10.1038/nrg2063
- ↵Wray GA, Hahn MW, Abouheif E, Balhoff JP, Pizer M, Rockman MV, Romano LA. 2003. The evolution of transcriptional regulation in eukaryotes. Mol Biol Evol 20: 1377–1419. 10.1093/molbev/msg140
- ↵Yamanouye N, Carneiro SM, Scrivano CN, Markus RP. 2000. Characterization of β-adrenoceptors responsible for venom production in the venom gland of the snake Bothrops jararaca. Life Sci 67: 217–226. 10.1016/S0024-3205(00)00626-3
- ↵Zambelli VO, Picolo G, Fernandes CAH, Fontes MRM, Cury Y. 2017. Secreted phospholipases A2 from animal venoms in pain and analgesia. Toxins (Basel) 9: 406. 10.3390/toxins9120406
- ↵Zancolli G, Casewell NR. 2020. Venom systems as models for studying the origin and regulation of evolutionary novelties. Mol Biol Evol 37: 2777–2790. 10.1093/molbev/msaa133
- ↵Zaret KS, Carroll JS. 2011. Pioneer transcription factors: establishing competence for gene expression. Genes Dev 25: 2227–2241. 10.1101/gad.176826.111