
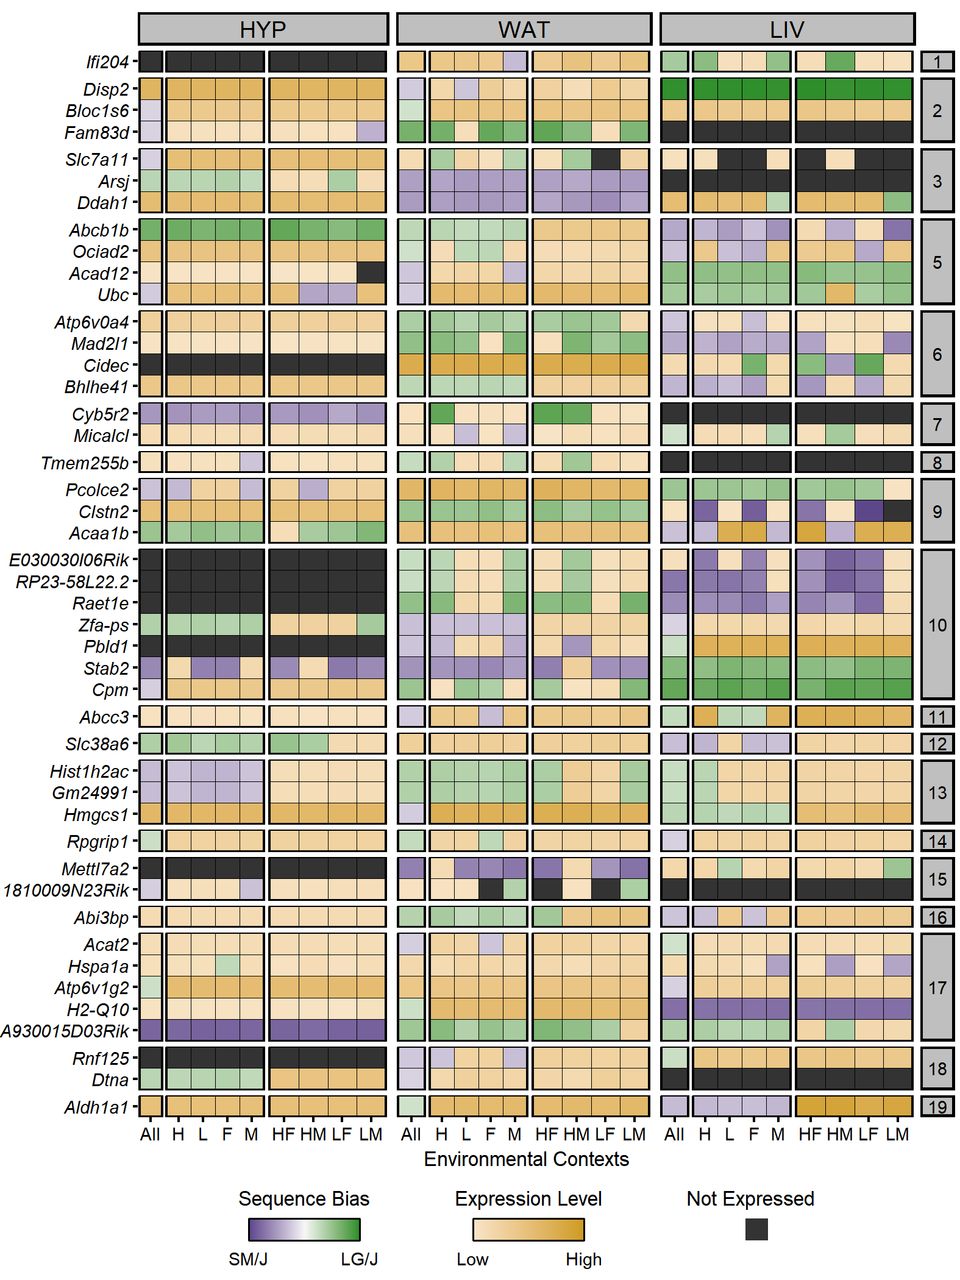
Forty-five ASE genes switch their sequence bias direction across conditions. Heatmap of ASE profiles for the 45 genes with significant sequence biases in opposite directions, including those validated with pyrosequencing. Genes are color coded by their expression pattern in each tissue-by-context analysis. Shades of purple and green indicate their degree of SM/J or LG/J bias, respectively (AGE scores). If genes are not biased, shades of yellow indicate their biallelic expression levels (log-transformed total counts). Black indicates genes are not expressed. The y-axis is grouped and sorted by chromosomal position. Supercolumns denote tissues: (HYP) hypothalamus; (WAT) white adipose; and (LIV) liver. Subcolumns denote environmental contexts: (All) all contexts; (H) high fat; (L) low fat; (F) females; (M) males; (HF) high fat females; (HM) high fat males; (LF) low fat females; and (LM) low fat males.


