
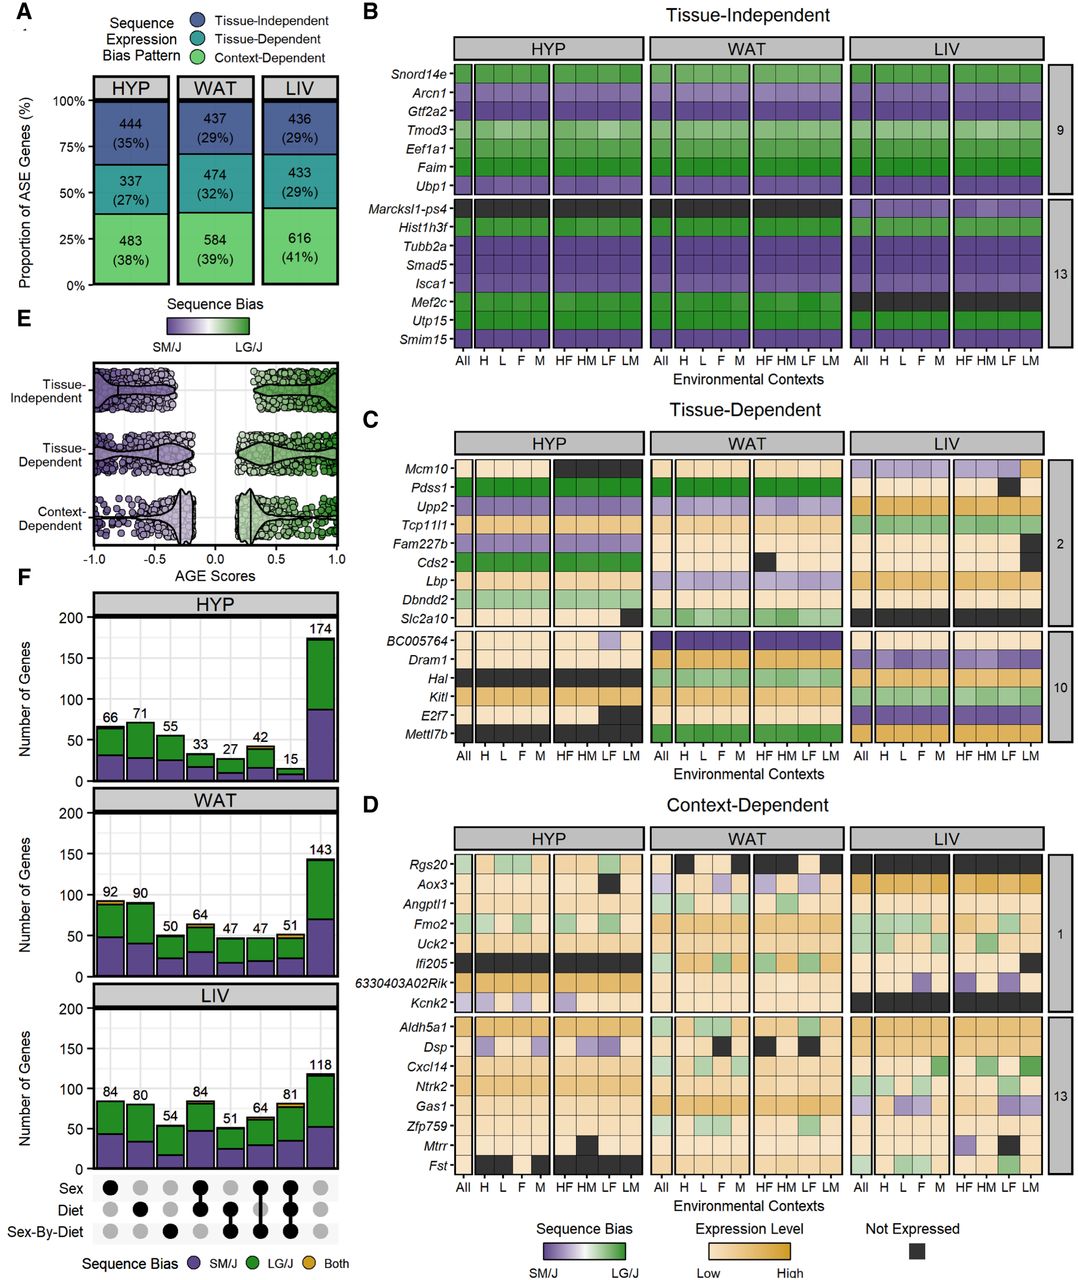
Sequence-dependent ASE patterns fall into three expression profiles. (A) Proportion of ASE genes per tissue with each sequence bias profile. Heatmaps of ASE profiles across analyses: (B) tissue-independent, (C) tissue-dependent, and (D) context-dependent. A subset of the 2673 genes are shown, including those validated with pyrosequencing. Genes are color coded by their expression pattern in each tissue-by-context analysis. Shades of purple and green indicate their degree of SM/J or LG/J bias, respectively (AGE scores). If genes are not biased, shades of yellow indicate their biallelic expression levels (log-transformed total counts). Black indicates genes are not expressed. The y-axis is grouped and sorted by chromosomal position. Supercolumns denote tissues: (HYP) hypothalamus; (WAT) white adipose; and (LIV) liver. Subcolumns denote environmental contexts: (All) all contexts; (H) high fat; (L) low fat; (F) females; (M) males; (HF) high fat females; (HM) high fat males; (LF) low fat females; and (LM) low fat males. (E) AGE scores for each sequence bias profile. Vertical lines indicate mean AGE scores. Dots represent individual ASE genes. (F) UpSet plots of the significant sex, diet, and/or sex-by-diet effects of context-dependent genes in each tissue. Bar height and color indicate how many genes with each sequence bias: (purple) SM/J; (green) LG/J; and (yellow) direction switching.


