
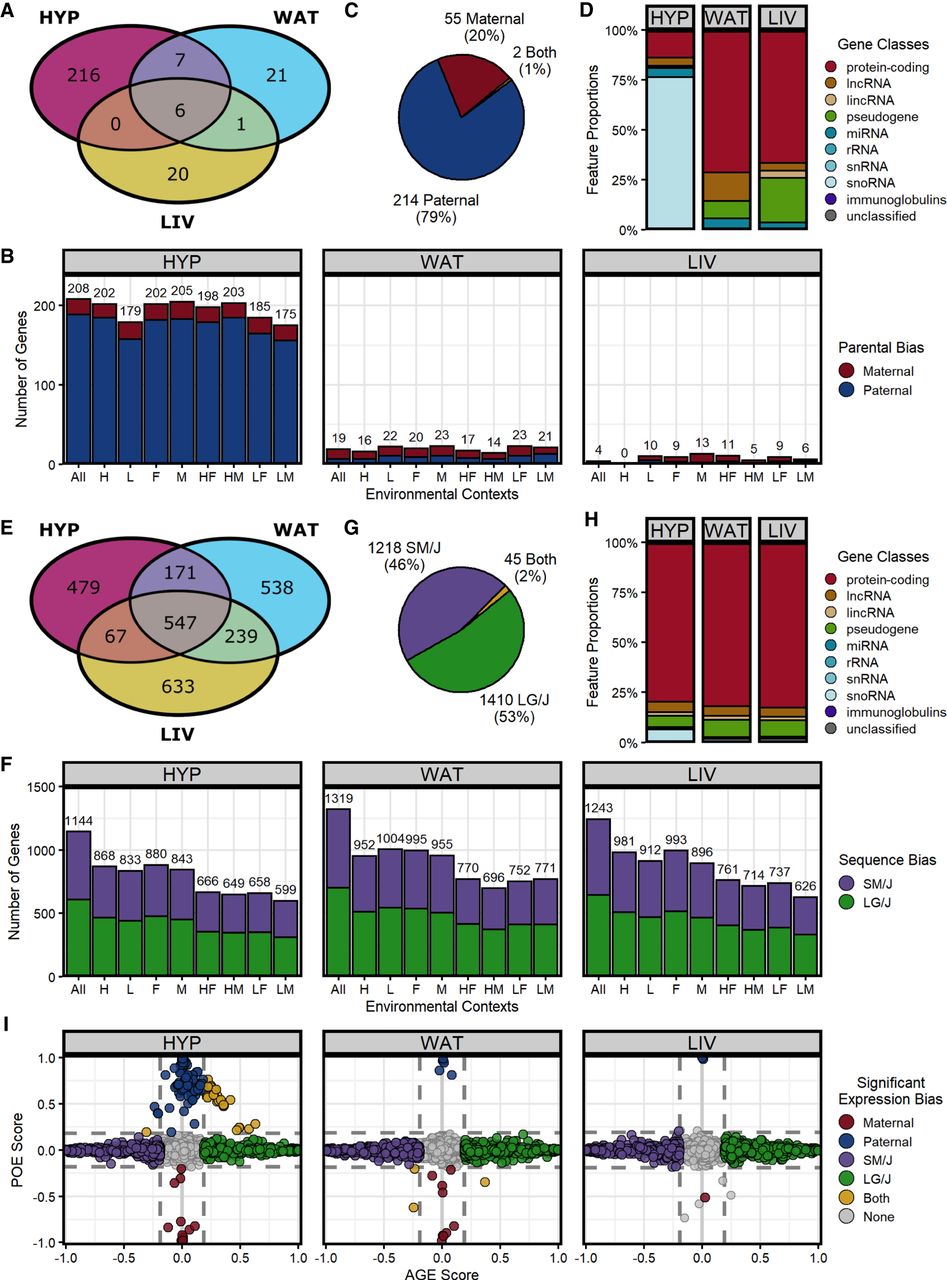
Both classes of ASE patterns are prevalent and distinct. (A) Venn diagram of all parent-of-origin-dependent ASE genes across tissues. (B) Number of significant parentally biased genes in each tissue-by-context analysis (maternal, red; paternal, blue): (All) all contexts; (H) high fat; (L) low fat; (F) females; (M) males; (HF) high fat females; (HM) high fat males; (LF) low fat females; and (LM) low fat males. (C) Summary of ASE biases across all analyses. (D) Proportions of gene classes in each tissue. (E) Venn diagram of all sequence-dependent ASE genes across tissues. (F) Number of significant sequence-biased genes in each tissue-by-context analysis (SM/J, purple; LG/J, green). (G) Summary of ASE biases across all analyses. (H) Proportions of gene classes in each tissue. (I) Parent-of-origin effect (POE) versus allelic genotype effect (AGE) scores in the “All” context of each tissue. Dots represent individual genes and are color coded by their ASE bias direction: (red) maternal; (blue) paternal; (purple) SM/J; (green) LG/J; and (yellow) both ASE classes. Most genes have no bias (gray). Dashed lines indicate significant score thresholds.


