
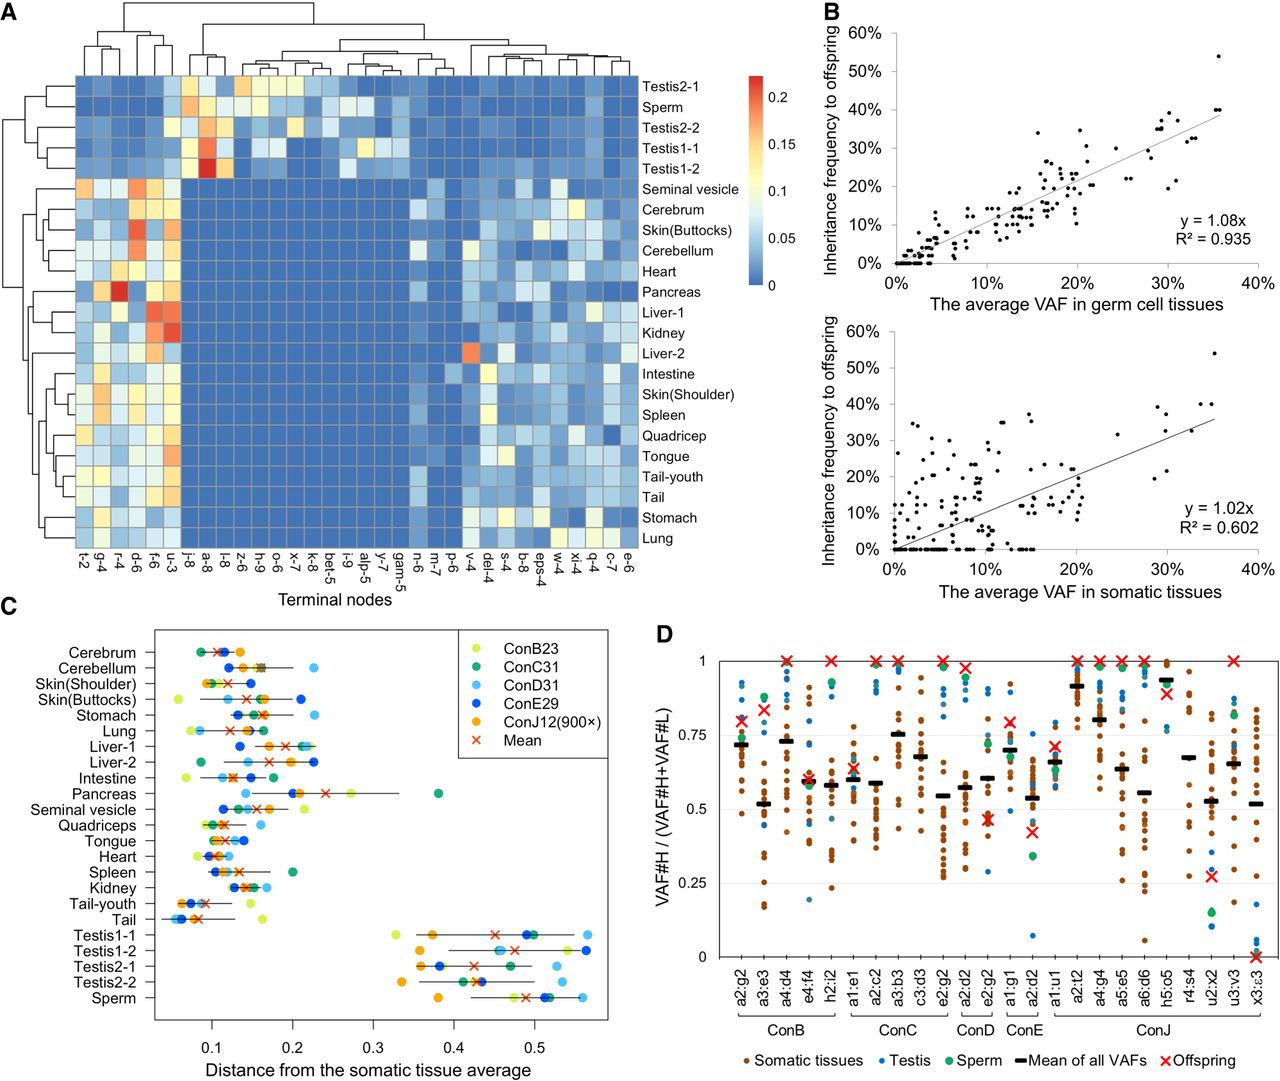
Contributions of each phylogeny to tissues. (A) A heatmap representing the contribution of the terminal nodes in the tree of mouse ConJ12 (Fig. 2E) for each tissue sample. The dendrogram represents the results of the hierarchical clustering. (B) The correlations of the average VAFs in tissues (somatic tissues or germ cell tissues) and the frequency of mutations inherited by the offspring. (C) The distance of the contribution of the terminal nodes between the values of each tissue and the average of all somatic tissues. (D) The contribution ratios of the two daughter cells after a single-cell division. VAF#H means the daughter cell had a higher average VAF relative to that of all samples, and VAF#L denotes the opposite condition. For comparison, the ratios of inheritance frequency of the mutations for the offspring are also shown.


