
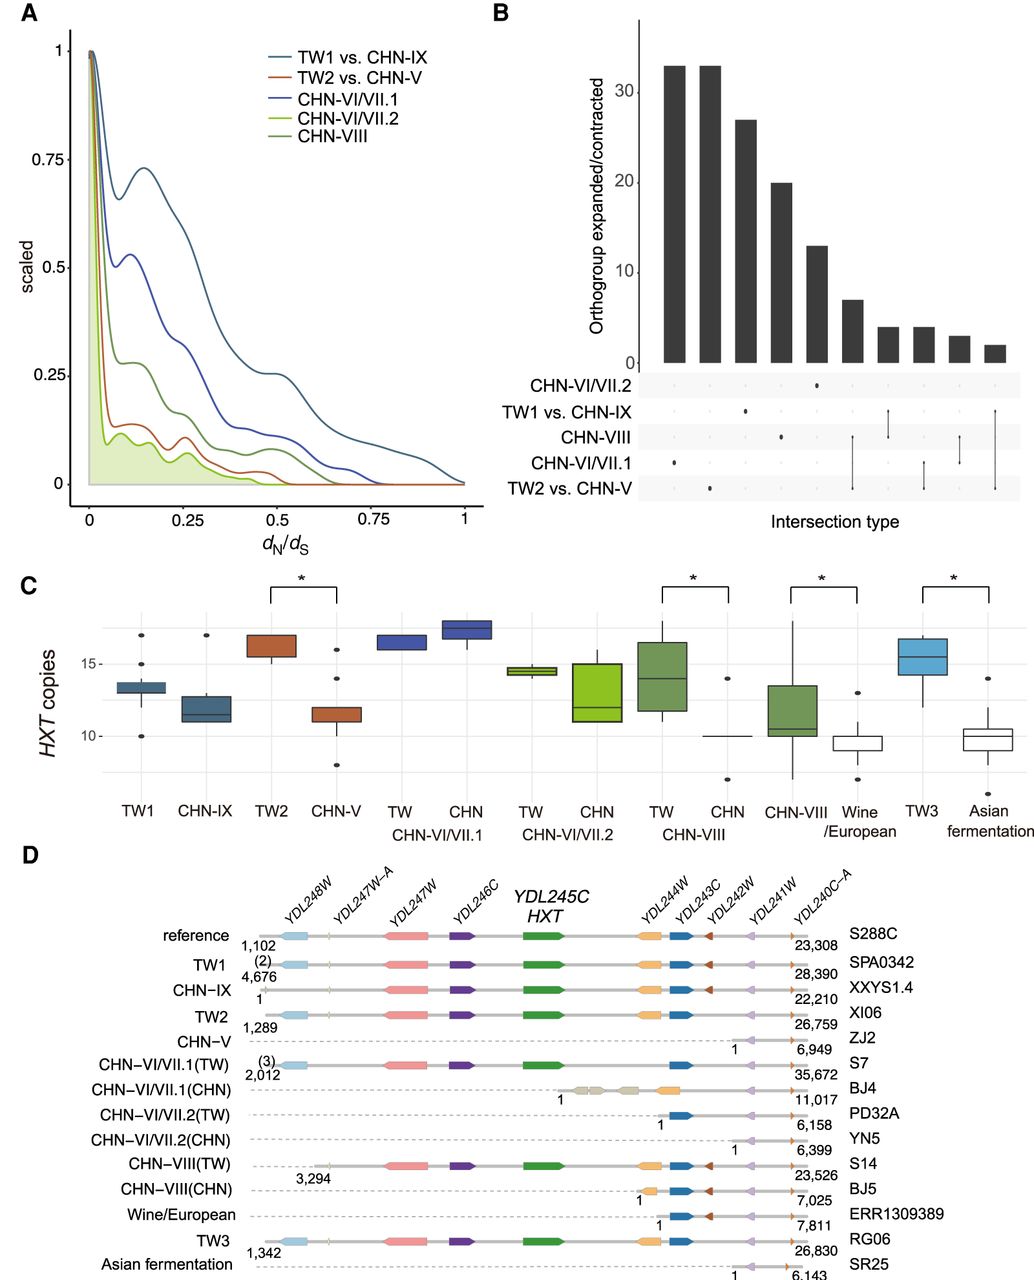
Figure 6.
Dynamics between lineages. (A) Density plot of dN/dS showing the majority of genes with dN/dS < 1. (B) Number of specific and shared orthogroups showing significant difference between pairwise lineage comparisons. (C) Distribution of HXT genes in each lineage. (D) Synteny of HXT and adjacent genes on Chr IV 5′ subtelomere. One representative S. cerevisiae isolate in each lineage was chosen. Numbers denote genome coordinates. Numbers in brackets were annotated genes until chromosome end.


