
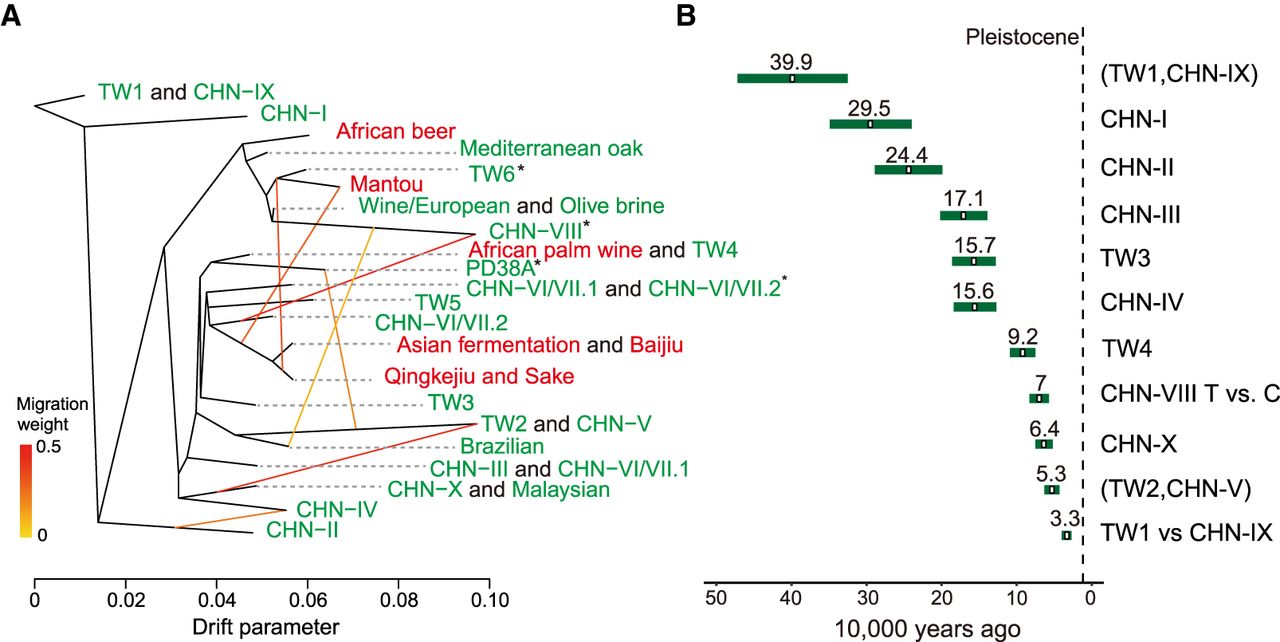
Figure 3.
Migration and divergence time between lineages. (A) Migration edges (yellow to red colored lines) estimated by TreeMix showing seven migration edges on the phylogeny. Different edge colors indicate the strength of migration. Lineages were colored according to isolation sources (red and green denote domesticated and wild environments, respectively). Asterisks denote lineages that contain multiple genetic components from different K from the ADMIXTURE analyses. (B) Molecular estimate of time to the most recent common ancestor in different S. cerevisiae lineages. The estimates are shown in Supplemental Table S9A.


