
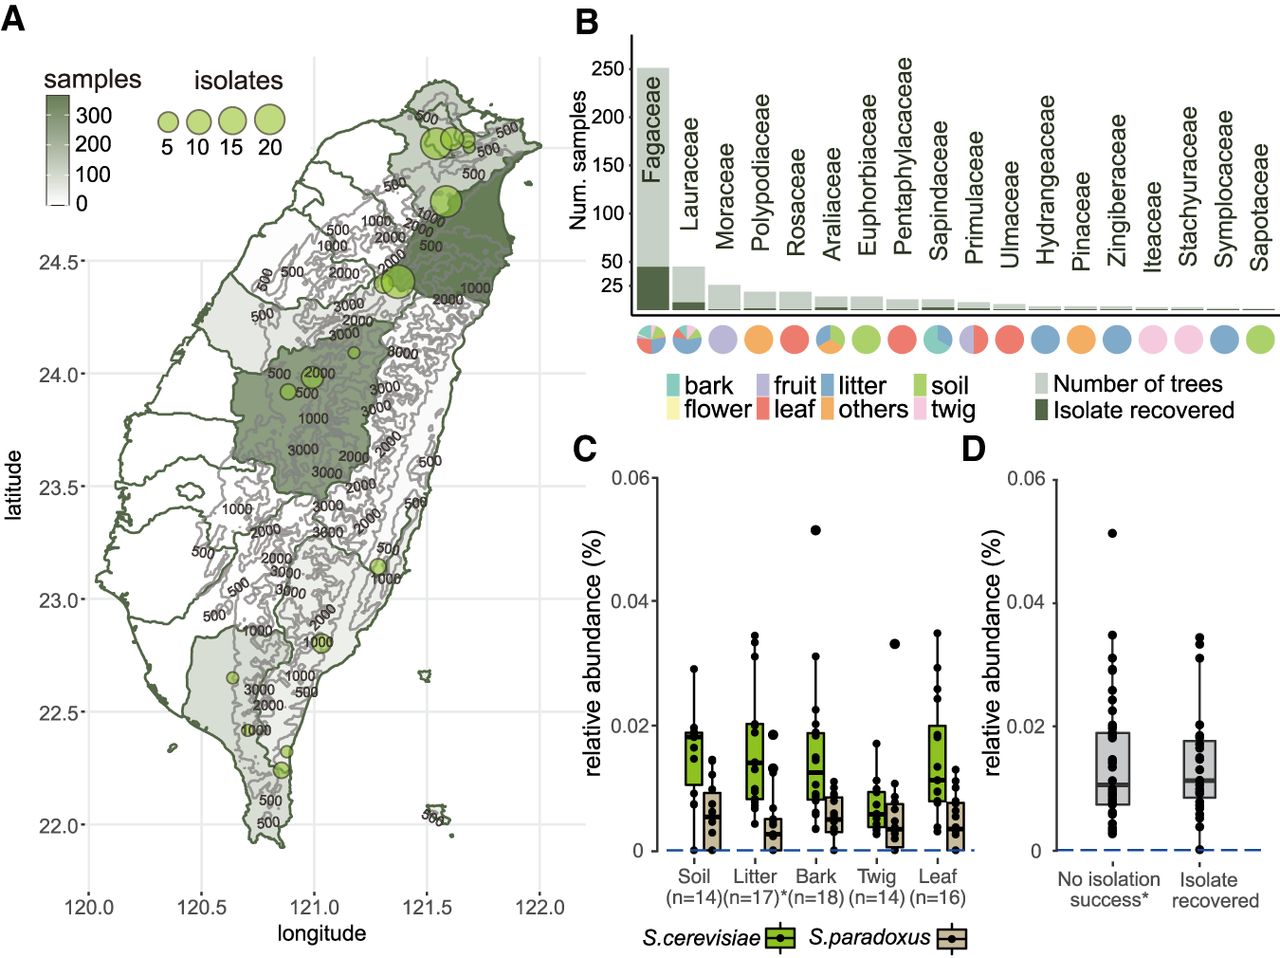
Sampling and isolation of S. cerevisiae in Taiwan. (A) Map of Taiwan showing sampling efforts in each county, with darker shades representing areas with higher numbers of samples collected and circles denoting the locations where S. cerevisiae was successfully isolated. One isolate found on Dongsha Island is not shown on this map. (B) Eighteen plant families from which S. cerevisiae was isolated. The darker color on each bar corresponds to the number of plants that yielded a successful isolation. Another 73 plant families from which we did not obtain any S. cerevisiae isolates are not shown. Pie charts below each bar represent the substrate surrounding plants from which samples were recovered. (C,D) Pairwise comparisons found no differences in the relative abundances of S. cerevisiae among bark, leaf, or twig (C; Wilcoxon-rank with Bonferroni correction: bark–leaf, P = 1.0; bark–twig, P = 0.118, leaf–twig, P = 0.461) and between samples with or without isolation success (D).


