
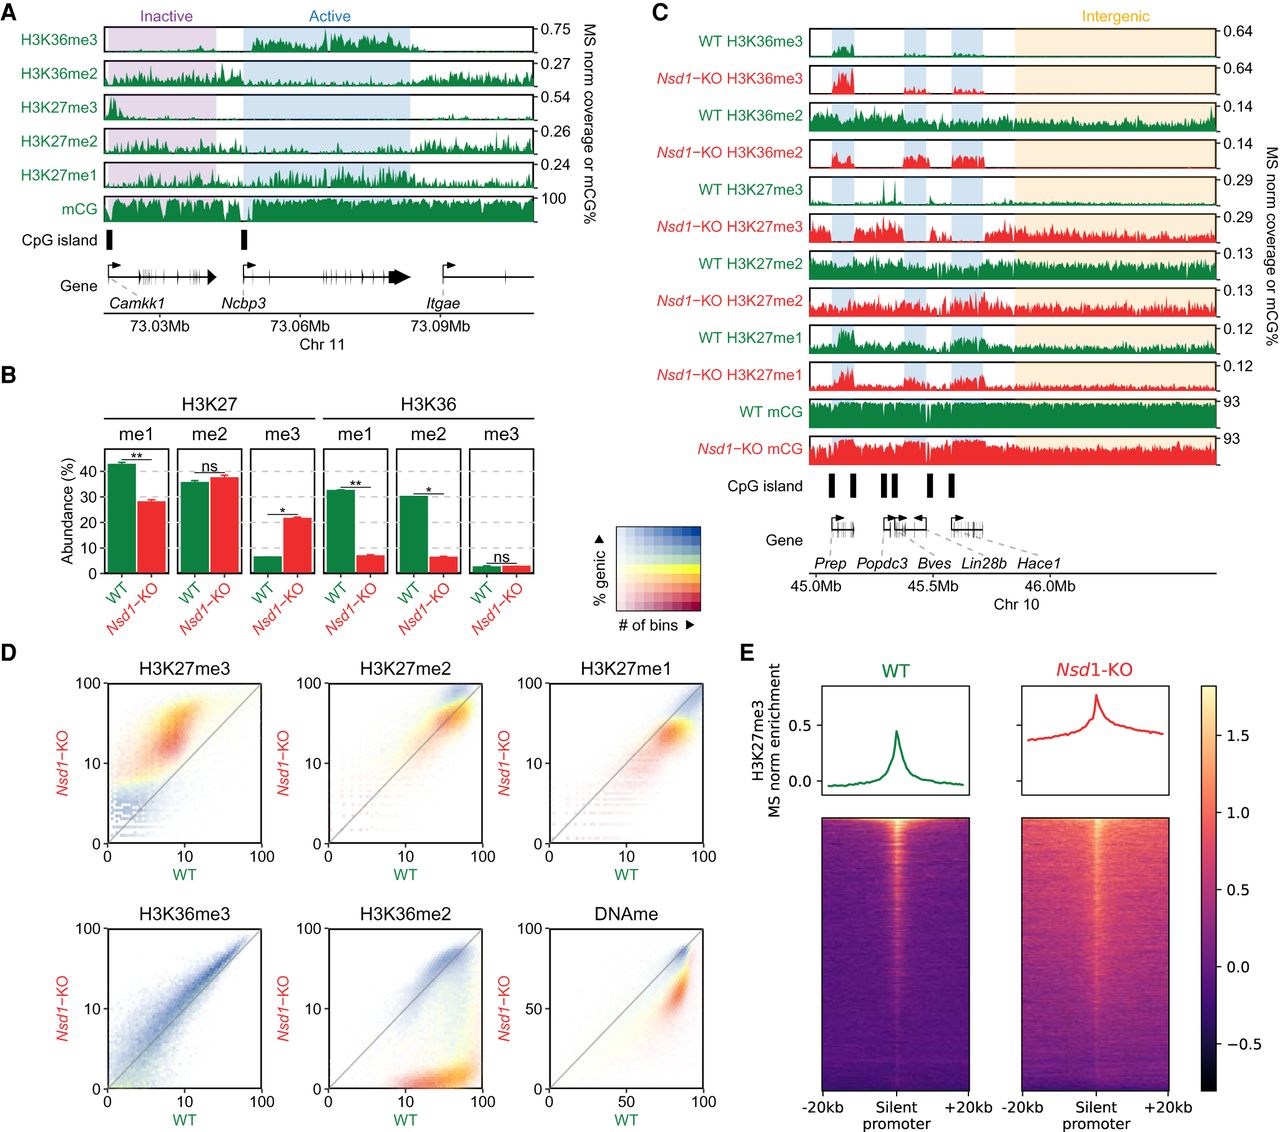
Distributions of H3K36me2/3, H3K27me1/2/3, and DNAme in mESCs and their reorganization in Nsd1-KO. (A) Genome browser representation of H3K36me2/3, H3K27me1/2/3, and CpG methylation (mCG) in wild-type mESCs, illustrating differences in epigenetic modifications around active versus inactive CpG islands (CGIs) and genes. The shaded areas indicate an inactive gene (purple) and an active gene (blue). The promoter of the silent Camkk1 gene on the left is an example of an unmethylated CGI serving as a PRC2 nucleation site resulting in an H3K27me3 peak. (B) Mass spectrometry (MS) analysis of H3K27 and H3K36 methylation levels (two replicates for each mark) in WT and Nsd1-KO, showing the gain of H3K27me3 and the loss of H3K36me2 in Nsd1-KO. Statistical significance levels are indicated based on t-test P-values: (****) [0, 0.0001); (***) [0.0001, 0.001); (**) [0.001, 0.01); (*) [0.01, 0.05); (ns) [0.05, 1]. (C) Genome browser representation of H3K36me2/3, H3K27me1/2/3, and CpG methylation (mCG) in WT (green) versus Nsd1-KO (red). Tracks are normalized using MS ratios. The shaded areas indicate active genes (blue) and an intergenic region (yellow). Genes transcribed at different levels are shown as examples, along with PRC2 nucleation sites (H3K27me3 peaks). The WT genomic distribution of H3K36me2 is broad, and H3K27me3 is much more localized. Nsd1-KO results in a drastic loss of H3K36me2 outside of transcribed genes, accompanied by nearly uniform spread of H3K27me3 into the regions vacated by H3K36me2. (D) Genome-wide correlation density plots of 10-kb binned ChIP-seq signal, MS normalized, shaded to indicate genic (blue) and intergenic (yellow) regions. In Nsd1-KO, the most drastic changes occur in intergenic regions and affect H3K36me2, H3K27me3, DNAme, and to a lesser degree H3K27me1. (E) Signal intensity plots (normalized by input and MS ratios) centered on transcription start sites (TSS) of inactive genes (n = 12,759) showing spreading of H3K27me3 in Nsd1-KO, indicated by the lower peak height and the higher enrichment in the surrounding regions in Nsd1-KO compared to WT. Replicate plots and additional synthesis of the data are in Supplemental Figure S1. Data used in this figure are generated in this study (Replicate 1).


