
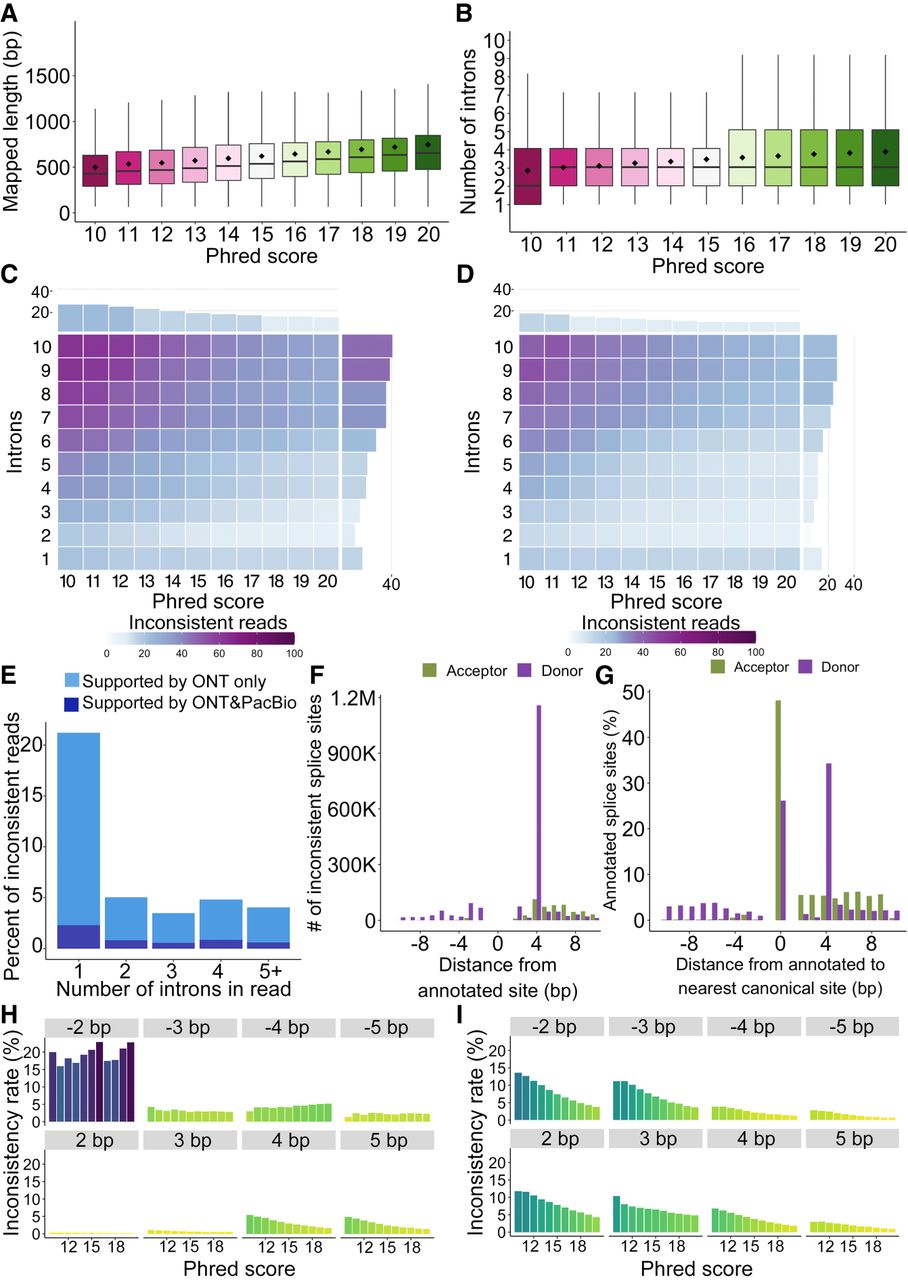
Characteristics of all ONT reads including nonbarcoded ones for Sl-ISO-Seq data. (A) Aligned read length with respect to read Phred score (average across all read bases) for all ONT reads from the Sl-ISO-Seq data set. (B) Read intron chain length with respect to read Phred score for all ONT reads from the Sl-ISO-Seq data set. (C) Heatmap showing average inconsistency rate between read intron chains and annotated intron chains (exact comparison, delta = 0 bp) with respect to read Phred score (x-axis) and intron chain length (y-axis) for all ONT reads from the Sl-ISO-Seq data set. Barplot at the top (on the right side) summarizes the inconsistency rate with respect to only the Phred score (only intron chain length). Purple corresponds to a higher inconsistency rate, and light blue indicates a lower inconsistency. (D) Same as C, but using inexact intron chain comparison (delta = 6 bp). (E) Histogram showing a fraction of inconsistent ONT reads that have at least one intron entirely contained inside an annotated exon. Dark blue represents reads for which the contained intron is supported by at least one PacBio read, and light blue corresponds to the rest of ONT reads. (F) Number of inconsistent donor (purple) and acceptor (green) splice sites in ONT reads from the Sl-ISO-Seq data set with respect to the distance from the annotated splice site. (G) Percentage of annotated canonical donor (green) and acceptor (purple) splice sites with respect to distance to the nearest canonical dinucleotides (GU for donors, AG for acceptors). Zero corresponds to the case when no canonical dinucleotides were detected within 10 bp. (H) Inconsistency rates of individual acceptor splice sites in ONT reads from the Sl-ISO-Seq data set with respect to reads’ Phred scores. Each histogram represents splice sites with a certain distance from the annotated splice site (gray bars on top). (I) Same as H, but for donor splice sites.


