
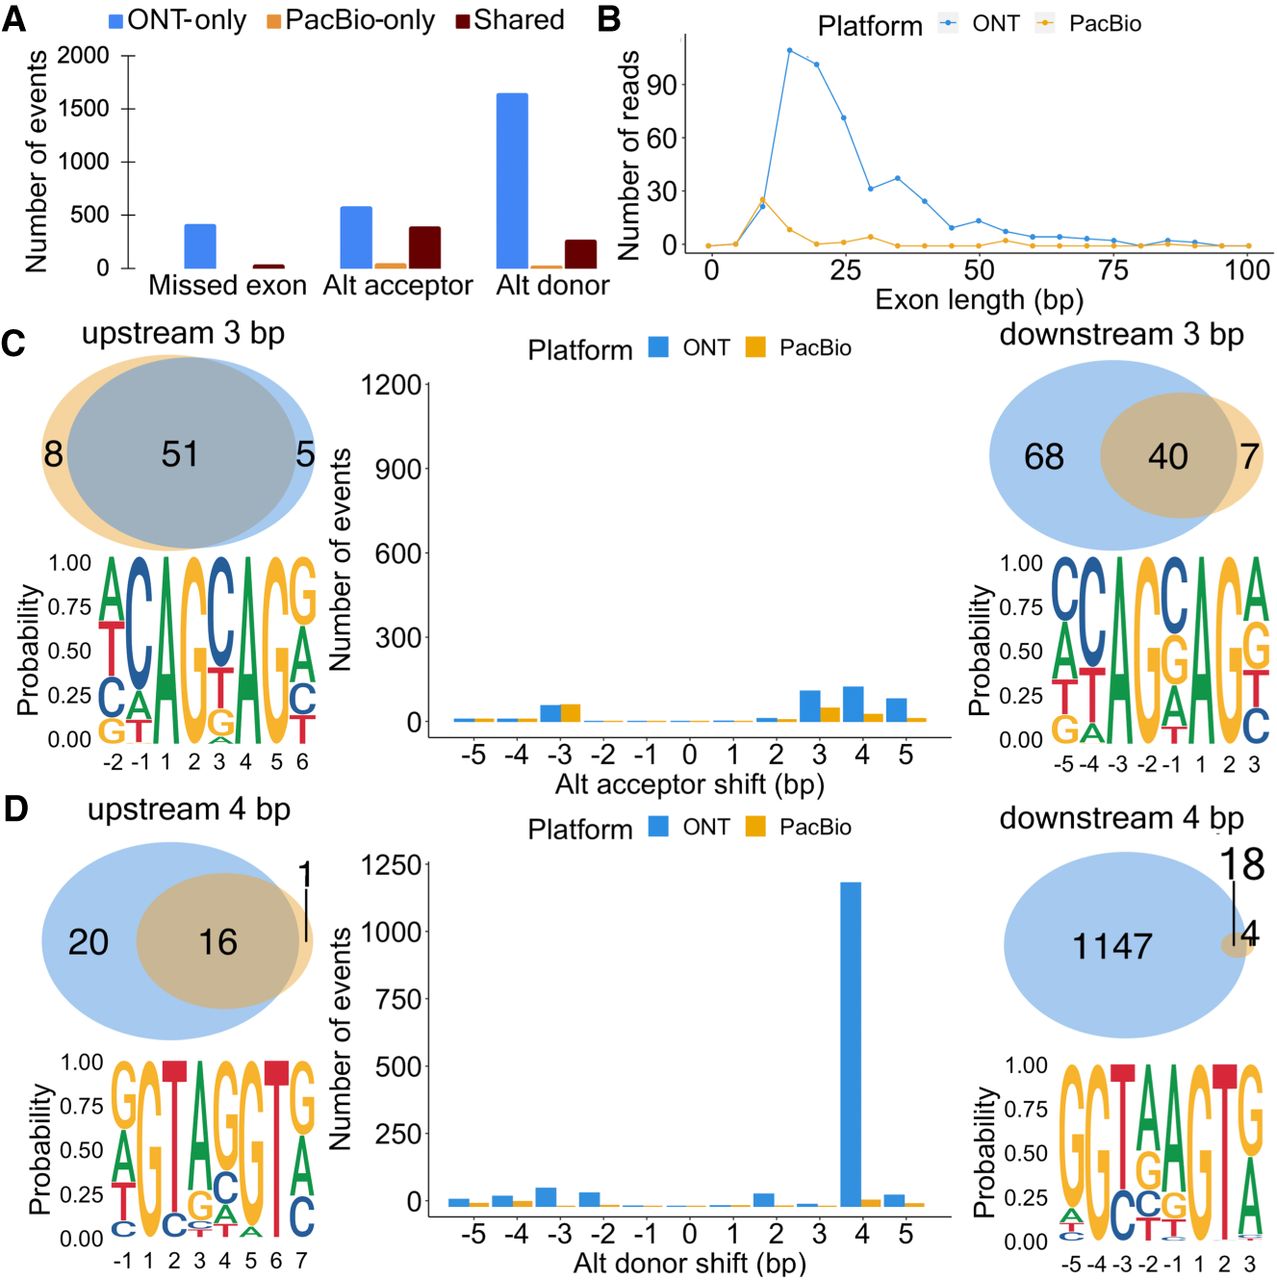
Exon and splice site characteristics underlying disagreements between PacBio and Nanopore in Sl-ISO-Seq data. (A) Number of missed exons (left), alternative acceptors (middle), and donors (right) with respect to the reference annotation that occur only in ONT read (blue), only in PacBio read (yellow), and in both reads from an RT read pair (brown). (B) Length distribution for skipped exons in PacBio reads (yellow) and ONT reads (blue). (C, middle) Number of alternative acceptor sites in PacBio (yellow) and ONT reads (blue) with respect to the distance from the annotated acceptor site. (Top left) Venn diagram for 3-bp upstream alternative acceptor sites in PacBio (yellow) and ONT reads (blue) from an RT read pair. (Bottom left) Nucleotide frequency for loci where 3-bp upstream acceptor sites occur. (Top right) Venn diagram for 3-bp downstream alternative acceptor sites in PacBio (yellow) and ONT reads (blue) from an RT read pair. (Bottom right) Nucleotide frequency for loci where 3-bp downstream acceptor sites occur. (D, middle) Number of alternative donor sites in PacBio (yellow) and ONT reads (blue) with respect to the distance from the annotated donor site. (Top left) Venn diagram for 4-bp upstream alternative donor sites in PacBio (yellow) and ONT reads (blue) from an RT read pair. (Bottom left) Nucleotide frequency for loci where 4-bp upstream donor sites occur. (Top right) Venn diagram for 4-bp downstream alternative donor sites in PacBio (yellow) and ONT reads (blue) from an RT read pair. (Bottom right) Nucleotide frequency for loci where 4-bp downstream donor sites occur.


