
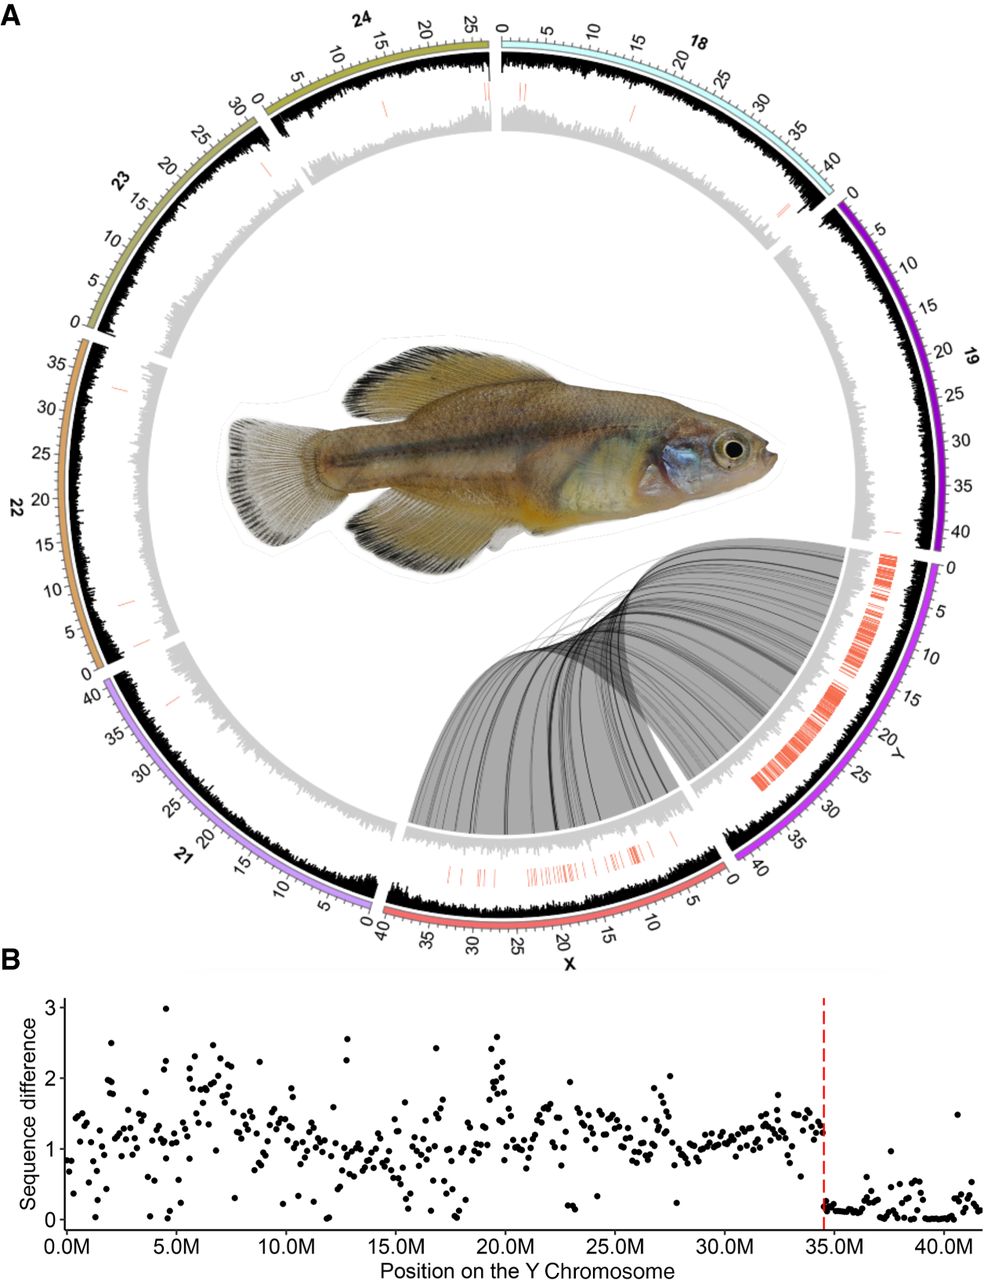
Figure 5.
Circos and dot plots showing synteny and sequence difference between Chromosomes X and Y. (A) Circos plot of Chromosomes 18 to 24 and both haplotypes of scaffold 20 (X and Y) showing repeat content (gray histogram), GC value (black histogram), male-specific RAD-tag hits (red bars), and synteny (linking ribbon) on chromosomes; (inset) image of a male darkedged splitfin adult. (B) Dot plots showing the sequence difference (percentage of SNPs and indels in windows of size 100 kb) between X and Y.


